Bacancy Technology
Bacancy Technology represents the connected world, offering innovative and customer-centric information technology experiences, enabling Enterprises, Associates and the Society to Rise™.
12+
Countries where we have happy customers
1050+
Agile enabled employees
06
World wide offices
12+
Years of Experience
05
Agile Coaches
14
Certified Scrum Masters
1000+
Clients projects
1458
Happy customers
- About Us
-
Services
-
AI/ML
- AI Consulting
- Generative AI
- AI Development
- Computer Vision
- NLP
- AI And ML Services
- LLM Development
- Adaptive AI
- ML Consulting
- Deep Learning
- Tensorflow Development
- ML Development
Artificial Intelligence
Machine Learning
-
Platforms
- Salesforce Customization
- Salesforce Implementation
- Salesforce Integration
- Salesforce Development
- Salesforce Consulting
- Salesforce Appexchange
- Salesforce CPQ
- Salesforce Data Migration
- Salesforce Managed Services
- Salesforce Staff Augmentation
- Salesforce App Development
- Salesforce Classic To Lightning Migration
- Salesforce Service Cloud
- Salesforce Marketing Cloud
- Salesforce Sales Cloud
- Salesforce Commerce Cloud
- Salesforce Financial Services Cloud
- Salesforce Support
- Microsoft Dynamics Consulting
- Dynamics 365 Implementation
- Dynamics 365 Integration
- Dynamics 365 Customization
- Microsoft Dynamics 365 Support
- SAP Consulting
Salesforce
Microsoft
SAP
- Industries
- Technologies
- Hire Talent
- Portfolio
- Contact Us
- book a 30 min call
November 21, 2023
Graphing the Time of Computing of a Particular Function in Python
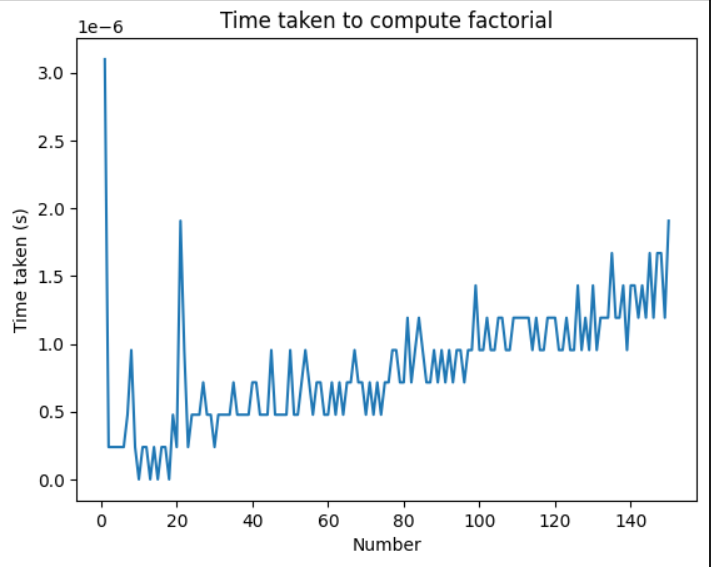
It seems like you’re trying to plot the time taken to compute the factorial of each number from 1 to 150. However, there are a few issues with your code:
- You’re not storing the time taken for each factorial computation. Instead, you’re overwriting dt in each iteration.
- The plot function is called inside the loop, which is not necessary and can cause issues.
- The plot function is not defined in your code. You might want to use a library like matplotlib.pyplot for plotting.
import numpy as np
import time
import math
import matplotlib.pyplot as plt


n = np.arange(1, 151)
dt = np.zeros_like(n, dtype=float)


for i in range(150):
    start_time = time.time()
    math.factorial(i+1) # replace np.math.factorial with math.factorial
    dt[i] = (time.time() - start_time)


plt.plot(n, dt)
plt.xlabel('Number')
plt.ylabel('Time taken (s)')
plt.title('Time taken to compute factorial')
plt.show()


