How to Debug Node JS Application Efficiently?
Last Updated on December 27, 2024
Quick Summary:
In this blog, we have explained how we can debug Node JS application and will share our developer experiences, which will help you to master debugging skills.
While working on any web project, sometimes we get stuck in complex problems, so we debug the backend code to understand the situation. Debugging is the skill by which we can explore these problematic situations, and with the help of this skill, we can see precisely how our code is executed one by one. We can also explore the values of the variable after a single instruction is executed.
Debugging is a very underrated skill and is often ignored by developers. This skill really helps you understand your code accurately, and it also improves your development skill so you can write your code very effectively. Putting console.log() in your code is not always a good idea; it’s also a time-consuming task.
We will now head up to the intended topic of debugging Node.js application.
Here are some points that you need to be familiar with before you debug Node Js application:
1. Basic understanding of node.js (Express)
2. Basics of javascript
To stay on Node.js debug process, let’s take it gradually.
We begin with a basic Node.js application with a single endpoint, and we do some random stuff here. You can use any node.js project.
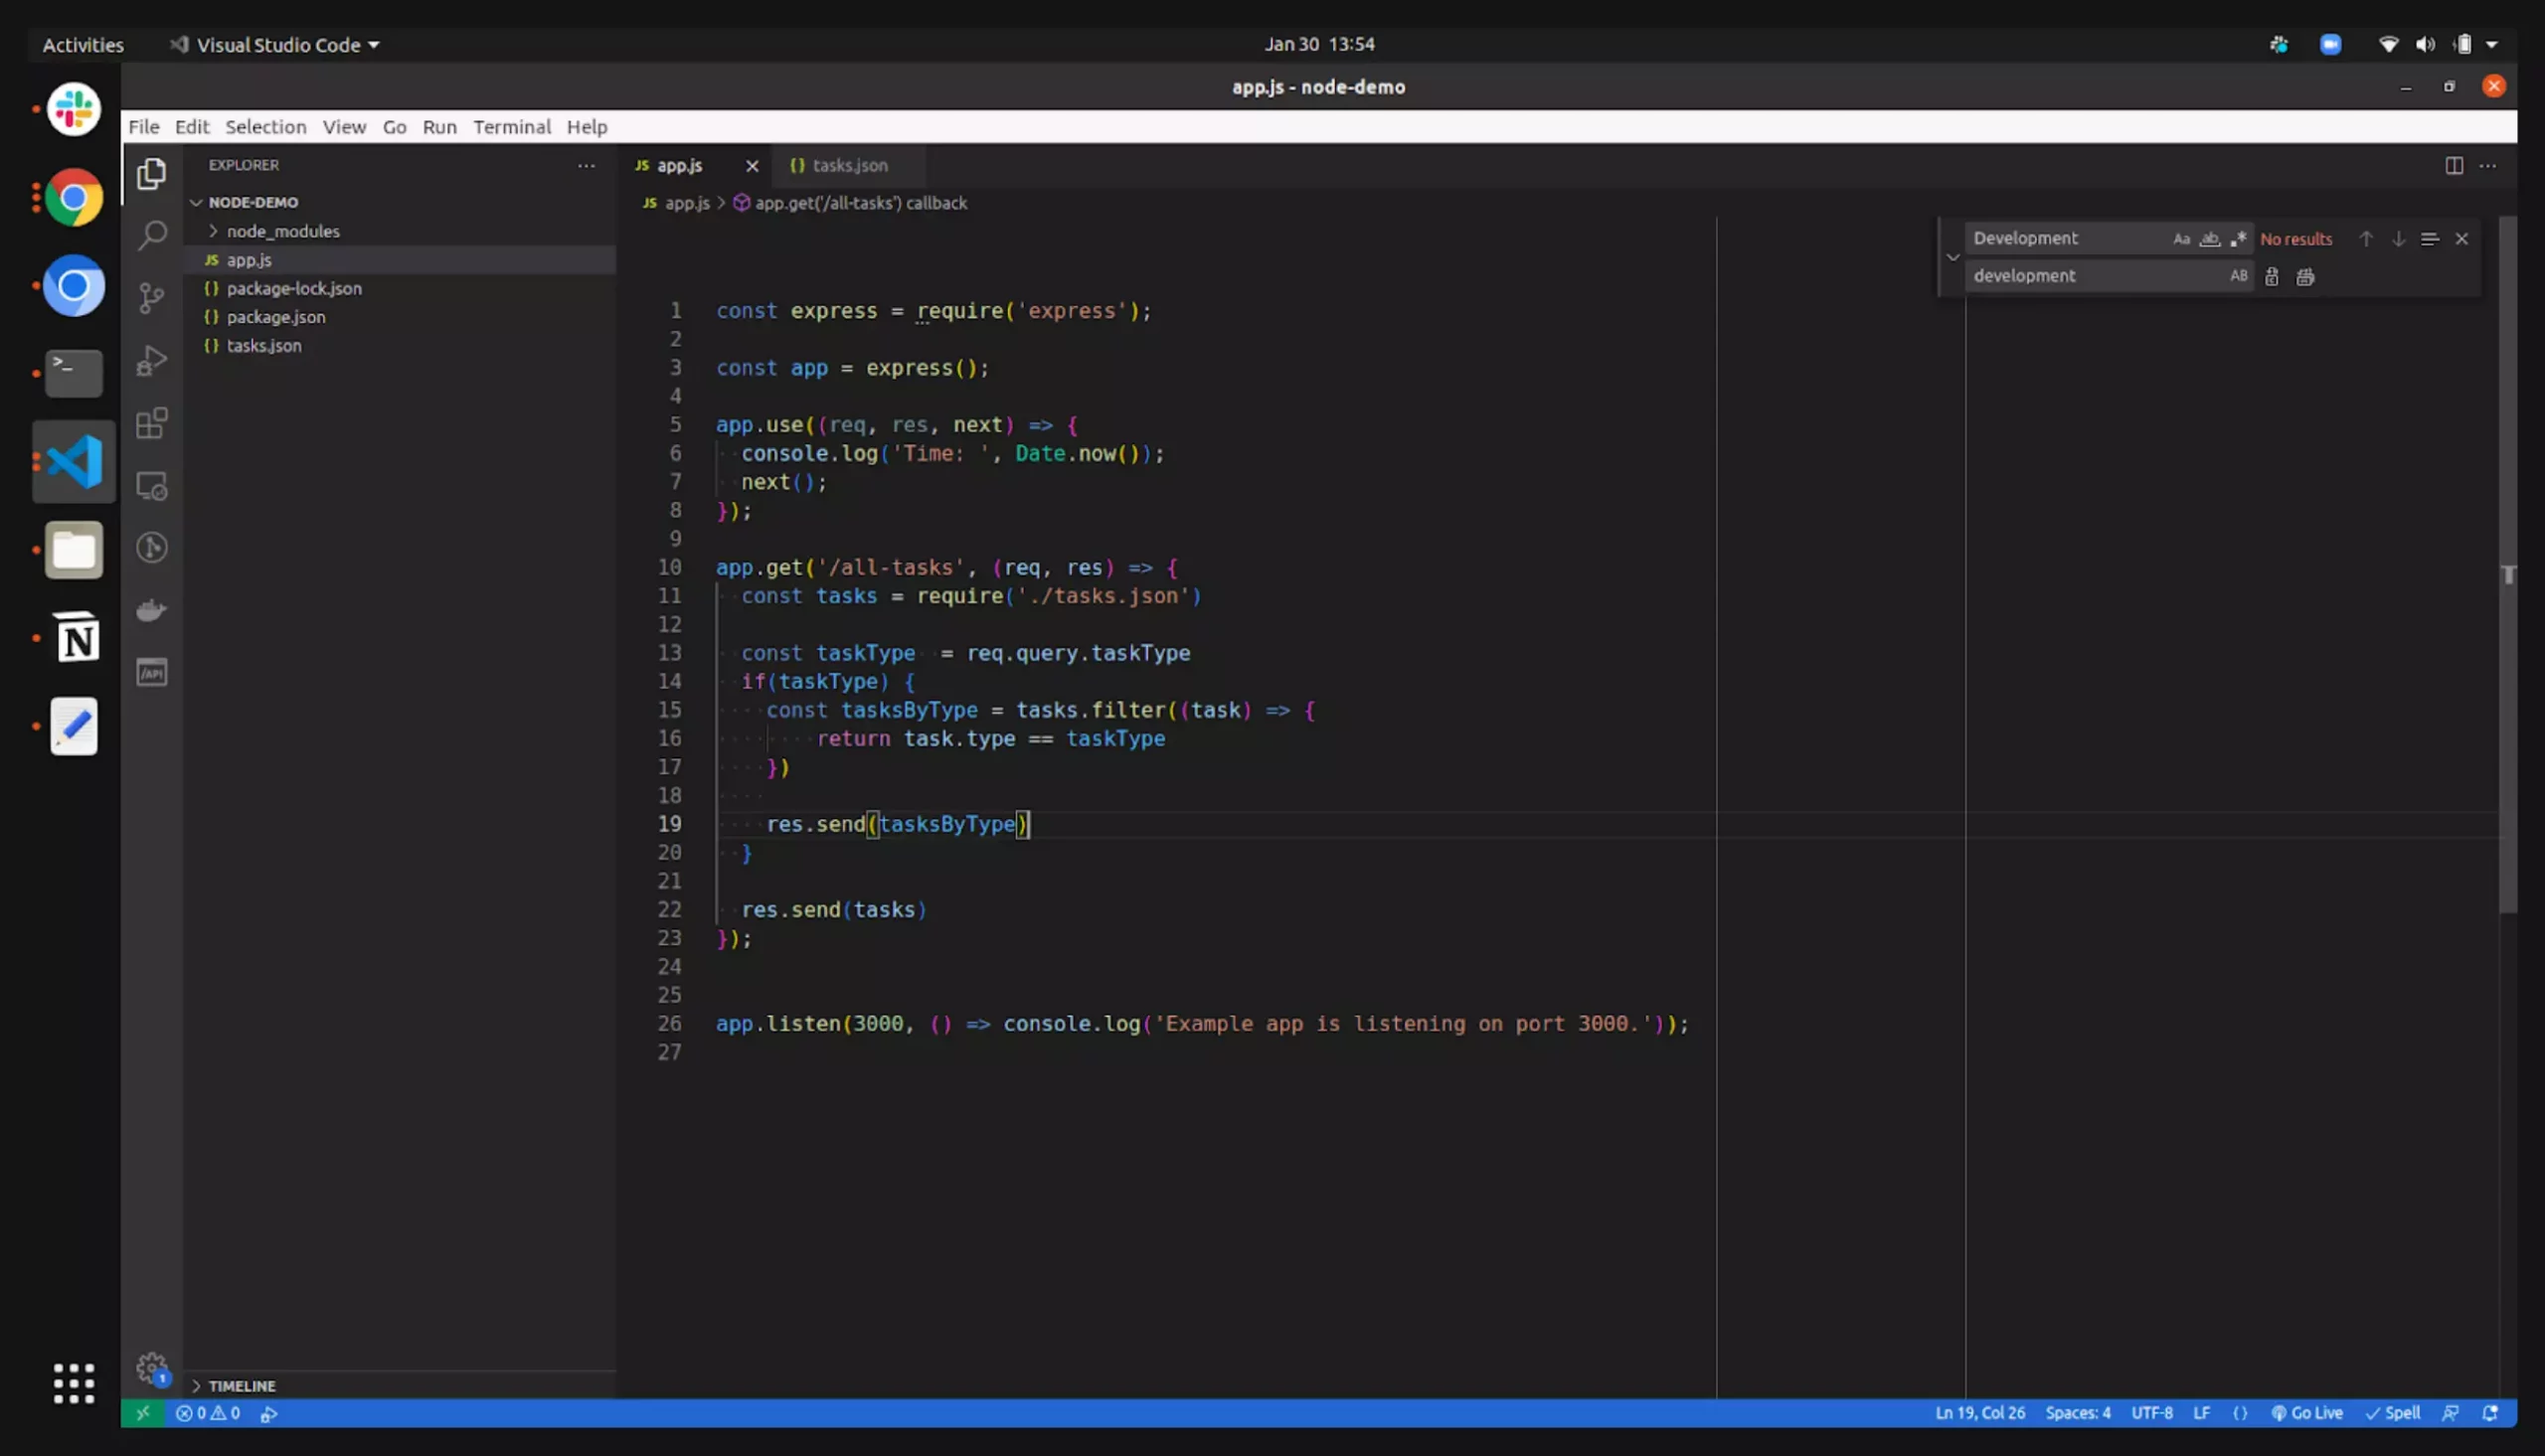
For now, we have a very basic application where we’re filtering objects from an array on the basis of given type in query parameters. Here is our main js file app.js.

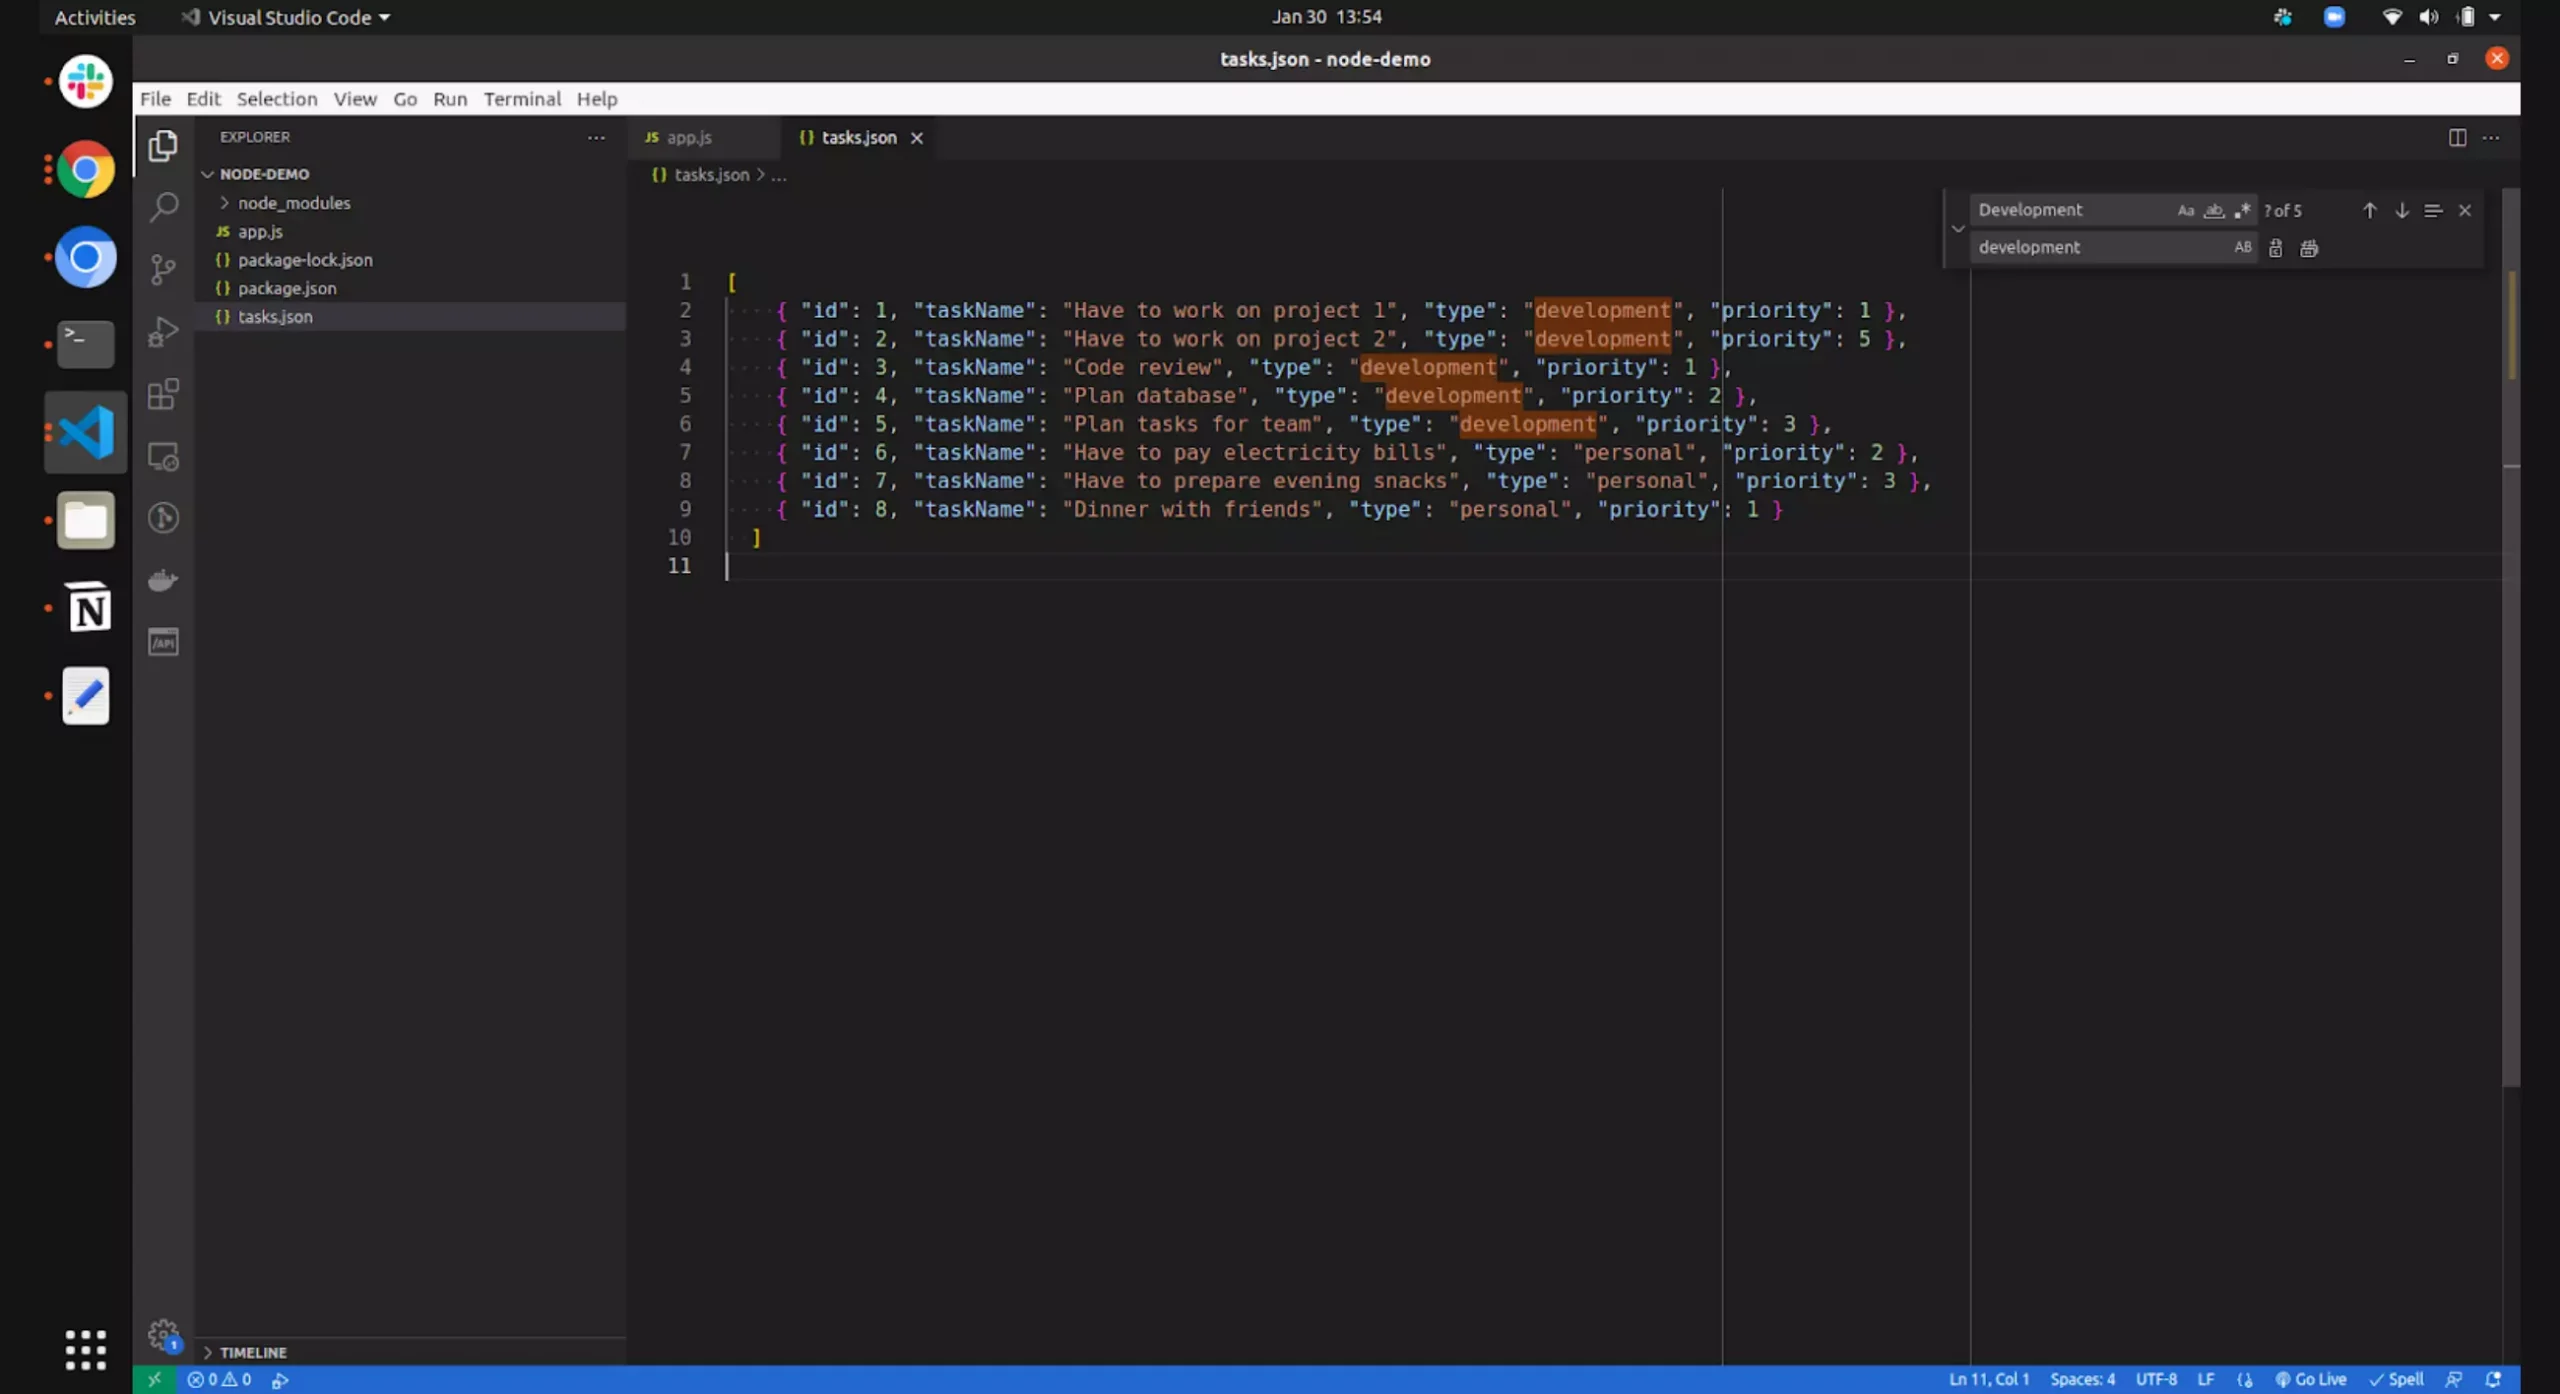
And here is the tasks.json file where we have an array of objects (list of tasks).

The above express app example is basic, where we’re listing and filtering tasks. The followings are the endpoint to perform this operation.
To fetch all tasks – http://localhost:3000/all-tasks
To filter tasks by given type – http://localhost:3000/all-tasks?taskType=personal
Now let’s continue with the next step for Nodejs debug process.
Are you struggling to debug your Node.js application?
Don’t waste time trying to fix the problem on your own. Hire Node js developer today and get your application running smoothly again.
We are using nodemon to debug Node js application. Let’s install nodemon globally, to install nodemon use this command:
Once nodemon is installed now we need to serve the node.js application with nodemon, and to do that, use this command:
Here app.js file is the main file of node.js application, by hitting this command your application will to served to a given port, for us it is 3000 so the application is running on http://localhost:3000
Now in next step let’s continue with enabling the debugging option in VS code.
Now its time to start the debugger in VS code. To start the debugger, open the command palette in vs code, and to open it simply press Ctrl + Shift + p in windows or Cmd + Shift + p in macOS. It will open the following section:

Now simply type “Debug: Attach” and you will see an option for “Debug: Attach Node Process” click on it, and after clicking, you’ll see the following screen:

These are just node processes that are running in your system, simply click on the first one, and you will see a debug controller like this:

We are almost done, our debugger is on now, now we just need to add some breakpoints so the execution will be going to stop there, but directly moving to breakpoints let’s first understand some basic stuff of debugger and debug controller.
We are numbering the elements in debug controller, and you can follow the respective numbers to understand their uses. Here is the debug controller:

Here is the explanation of each section.
? Play/Pause: Used for start and pause debugging
? Step In: If want to execute instruction line by line then it will help you to execute step-by-step instruction
? Step into: Let if you are calling a function in between the script then you can simply get into those functions also, it means by this option you can deep down to a function or statement and debug there as well.
? Restart: Restart Debugger from the start or first breakpoint
? Disconnect: Used to stop debugging
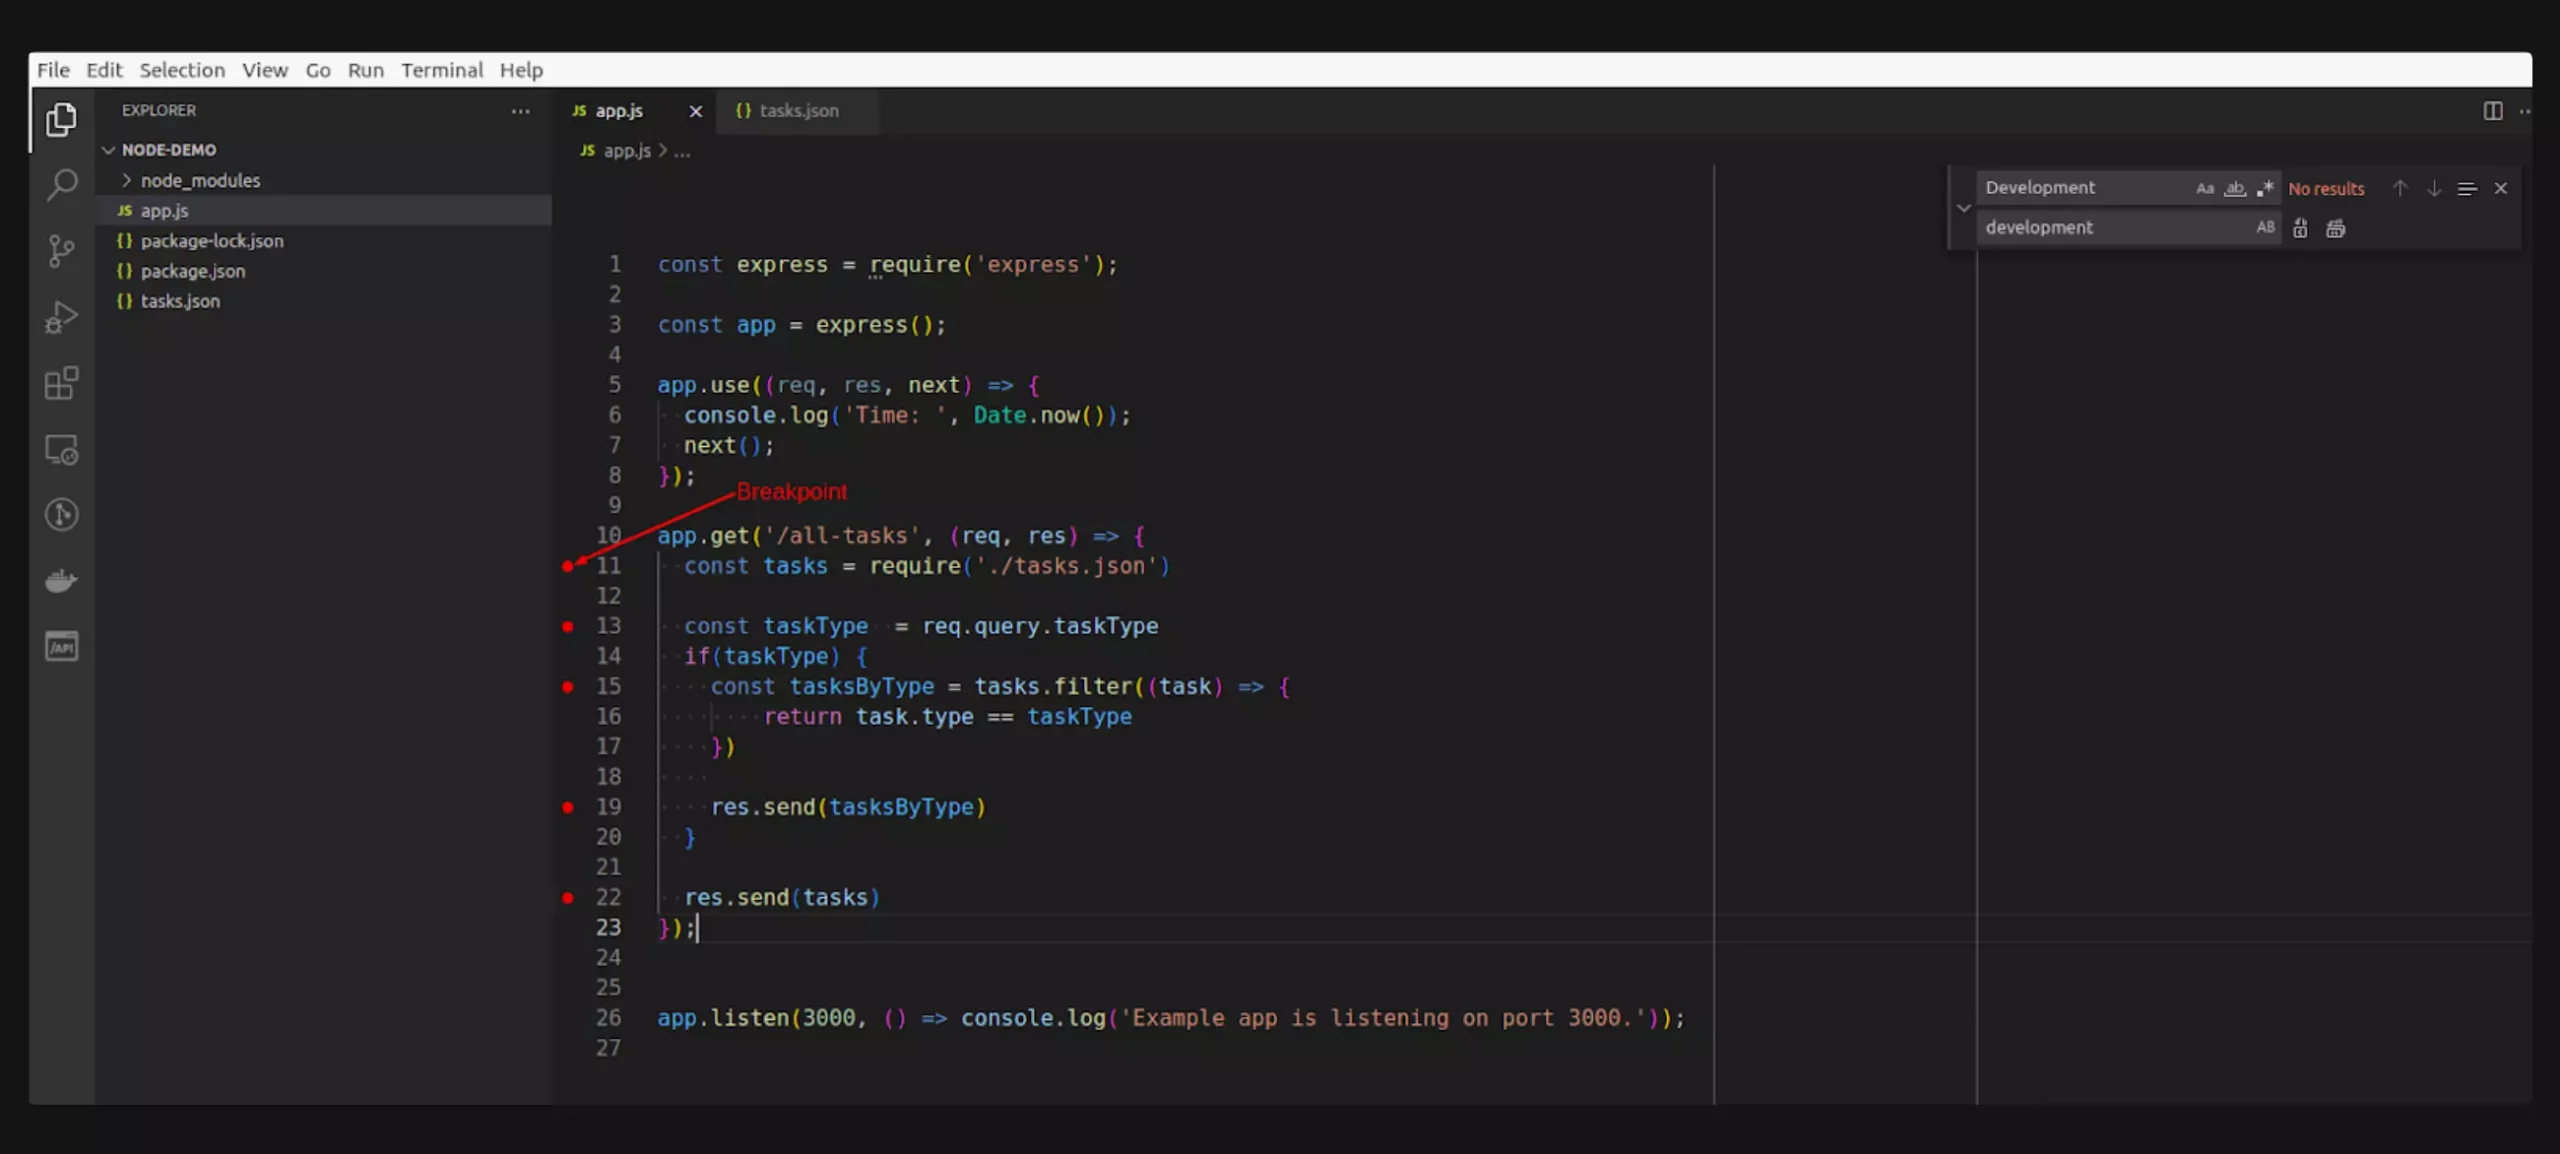
Breakpoints are a main entity of debugging, it tails debuggers from where to stop the execution. By putting breakpoints to your code you are tailing to a debugger that stops execution here and tails the executed variables value here.
You can apply breakpoints by clicking the left side of the editor (left side of the line number column), Following is a screenshot of some breakpoints.

Once you added the breakpoint now the execution will going to stop here, let’s run the debugger now and see how it works.
Follow Step 2 & Step 3 to turn on the debugger. Once the debugger is active, let’s hist to the endpoint by which the code will be executed.
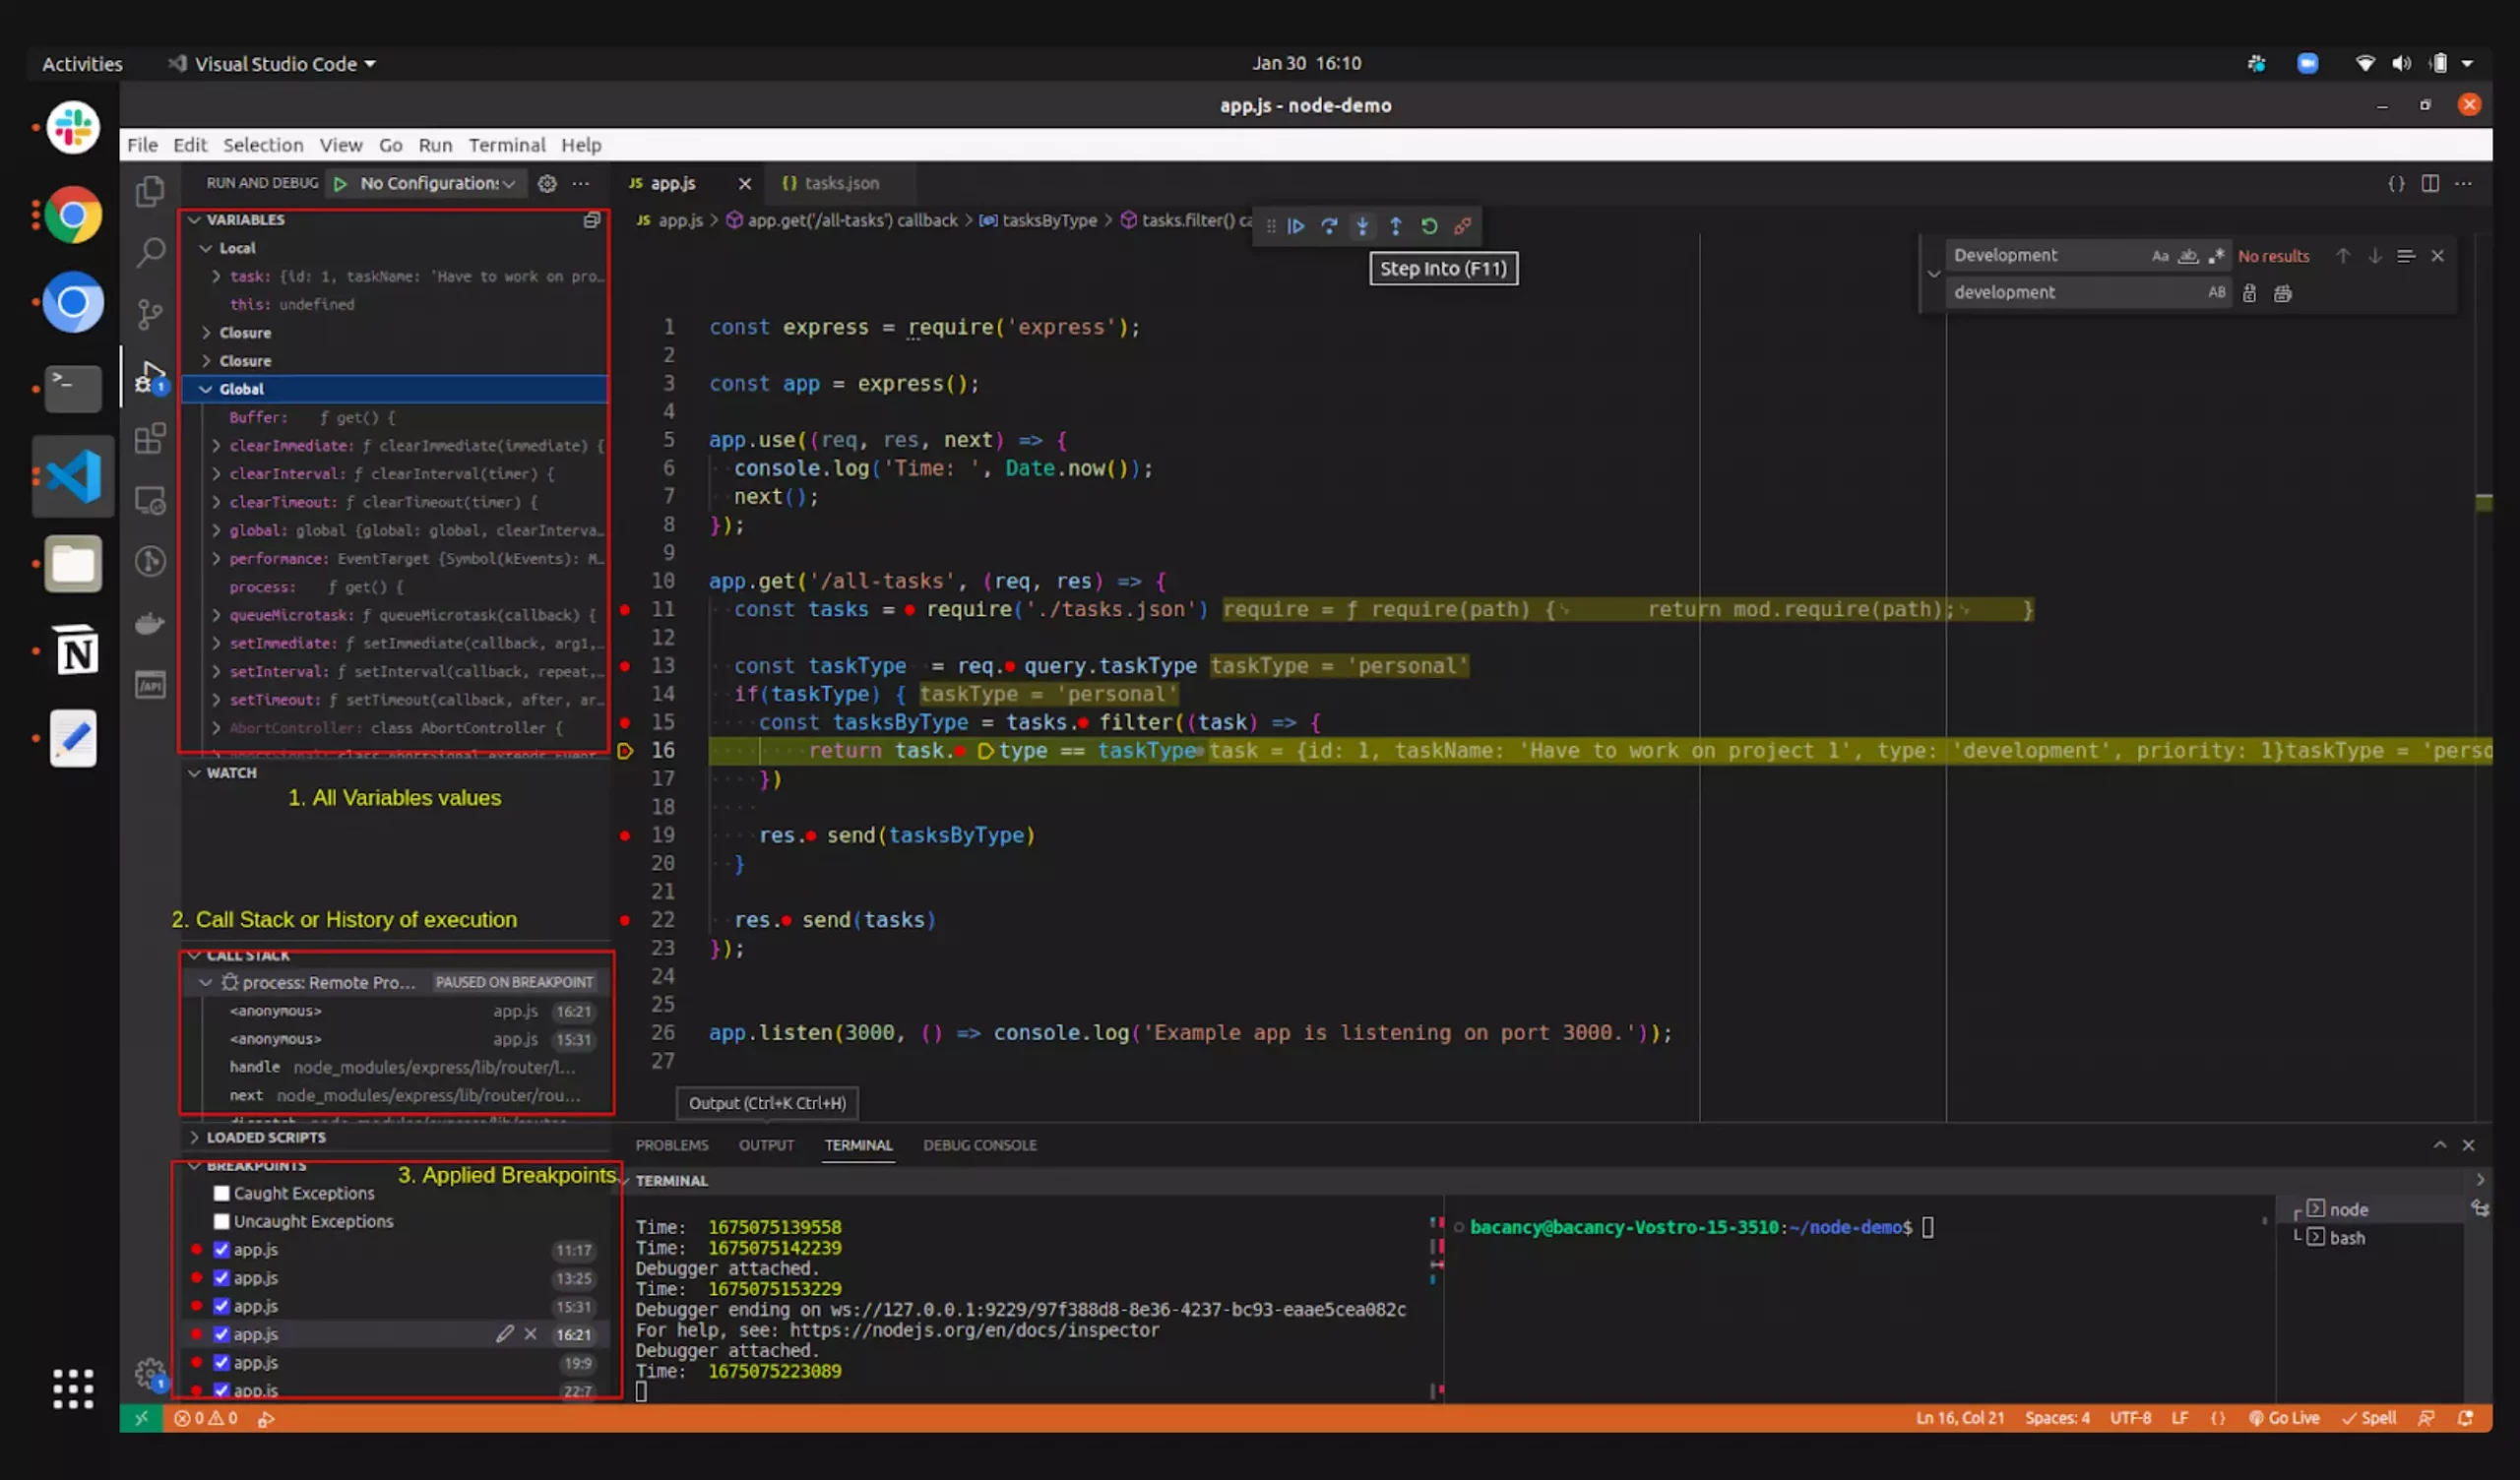
Once you hit the respective endpoint or execution starts for the code section in which you have mentioned the breakpoints, you will see a screen like the following:

This is how it looks when execution stops. This is complete data while executing your code line by line. Let us explain these sections so that you can better understand how to debug Node js application.
? Variables section: This section shows all the variables used in that code section you can also see the respective values of that variable. You might see some variables are undefined or null its because execution has been stopped once the execution for a variable has been finished then you will see the real-time value of that variable
? Call Stack: It’s simply a history of all execution, for example, you can see all execution which was done before the current execution
? Breakpoints: In this section, you can find all the breakpoints which you have added all over the project, this section manages all breakpoints in a single place
That’s about the debugger and how to debug Node js app. We hope this tutorial could help you achieve Node Js debugging. For more such intriguing practicals, you can check our Node tutorials.
Happy Coding 🙂
Nodemon is a custom command line tool, specific for NodeJs for the speedy backend development of applications.
We use breakpoints to stop the debugger executions in between when need be. For eg. to check the state of variables or else.
You can debug a Node application by the core Node.js debugger, through the Node inspector, or by using the built-in debugger in IDEs such as Visual Studio.
Your Success Is Guaranteed !
We accelerate the release of digital product and guaranteed their success
We Use Slack, Jira & GitHub for Accurate Deployment and Effective Communication.