Quick Summary:
The fantastic features of the ReactJS library like virtual DOM architecture, reusable components, isomorphic javascript, and more make it a perfect fit for building comprehensive and descriptive dashboards. Read in-depth to learn why ReactJS for dashboards and data visualization is a must to lead your business to more outstanding attainments. Know about the types of ReatJS charts and varied dashboards development facilities in this blog.
Table of Contents
Overview
I love automation, especially my new automatic car. It’s like everything is up-front of me, and I just need to touch it and it works for me the way I want. Dashboards are exciting for me. They’re like a magician’s pandora box.
You might feel that my above explanation is out of the blue, but I have felt somewhat similar these days. I keep track of my work- my blogs regularly. I love to see the data in graphical representation; it helps me make the right decisions and actions.
Dashboards are incredibly vital for a business enterprise in various aspects. They enable you to march in the right direction and quickly balance on your flaws.
Why are dashboards and data visualization important in projects?
Each business empire looks for ways to increase productivity and reduce costs. Industries like healthcare, HR, logistics, sales, marketing, etc., all need dashboards to take insights into the daily, weekly, and annual business analysis. Dashboards give you a clear perspective and vision that enable you to make crucial decisions for your organization.
Underlying are some of the essential benefits of implementing Dashboards for your business:
- Access to data– Easy access to data so you can prioritize your tasks, actions, and decisions.
- Data Visualization– Get clear insights into your business data from the dashboard home screen.
- Better decision making– A quick glimpse of your business workflow enables you to make the right call for action at the right time.
- Accountability– With an analytics dashboard, you get the reliability that you shall never take a wrong step for your organization.
- Interactivity– Several department and domain heads administer your business data dashboard. They can communicate and contact inter-department sectors for mutual benefits.
- Gamification– The intuitive and straightforward display of information leads you to better decisions and actions. The dashboard gives you a gamified feeling.
Why is Data Visualization needed?
Most businesses get to leverage the advantages of a Business Dashboard; even more, some giant organizations even need multiple dashboards to measure their internal and external key performance indicators KPIs.
Of all the abundant digital data on the internet, 90% of it has been assembled in the past 3 years. Additionally, 3.2 billion gigabytes of data are generated annually. There are over 2 trillion connected devices in today’s world, and to access such a huge amount of data, react data visualization is a must.
You might be wondering whether your business truly needs data visualization or if it’s time to explore professional data visualization services to gain valuable insights
- You need to visualize your data when you feel that your company can improve its functioning, but you are confused about how to or where to begin.
- When you don’t know what to do with the analyzed data or how to use it.
- When your current solutions do not meet your expected ROI, you need to get insights into your business data.
- When, despite all the hard work and efforts, you are still unable to match your competitors.
- If you’re struggling to get an overview of your business data from multiple sources at one screen, go for data visualization.
And once you opt to go for React for data visualization, you get the following benefits:
- You learn to identify the areas that need attention or improvement.
- You get the clarification of the factors that influence your customer behavior.
- You can predict your sales volumes.
- You can learn about your products and your customers.
- You will digest large amounts of data at scale.
- Compare and contrast from your competitors.
- Spot trends and patterns customized.
- Reveal questions that would otherwise be missed.
Significance of ReactJS for Dashboards and Data Visualizations in Modern Businesses
ReactJs javascript library builds the best use cases of Dashboards and data visualizations. To weigh the crux of Artificial intelligence and Business Intelligence, data visualizations become an essential aspect.
ReactJS enables you to build data-heavy and interactive data visualization dashboards. Here, we have mentioned how React is the ideal choice for building dashboards for your business.
Component Reusability
With ReactJs for dashboards and data visualization, you can build modular and self-organized code that enables kick-starting your dashboard app development. You just need to visualize what features and aspects you want in your dashboard. ReactJS gives you the liberty to reuse the components, make them self-contained, and organized.
Virtual DOM
You get updates for your dashboard quickly and essentially, thanks to the virtual DOM structure of ReactJS. Dashboards are meant to be accurate- with time, and hence real-time data sticks to the screen in front of the user. The re-rendering of components is feasible due to React’s virtual DOM architecture. With ReactJS dashboards, you get instant notifications, non-stop updates, and data-charts on the go.
Isomorphic Javascript
A dashboard needs to be like a client-side single-page application SPA with high-speed rendering. When the user needs to wait for a few seconds, that becomes ugly, and isomorphic javascript enables the fast rendering of web pages.
Isomorphic javascript overcomes business concerns like:
- Poor SEO
- Bad performance
- High Maintainability
Continuous Development of Library
React developers keep you regularly updated with the latest features and react libraries. Hence you are assured that by opting ReactJS for dashboards and data visualization drives your business on the top with cutting-edge trends.
Great Ecosystem
React gives you a vast community of pre-built solutions for you to reuse. Most of the reactJS developers get the answers to their problems readily. There are charts, documentation tools, graphics, and other components that you can reuse.
ReactJS comes with tons of visualization tools and integration tools. Your users get a fantastic user-experience as you develop your data-intensive dashboard application using ReactJS.
Save up to 40% on Development, Maintenance, and Support Cost
Contact Us and hire React developers to Upscale Your Product Development Capabilities
Types of Reactjs Charts
Choosing ReactJS for dashboards and data visualization is the best way to expand your business growth and performance. There are several ReactJS charts readily available that you can use in your dashboard example.
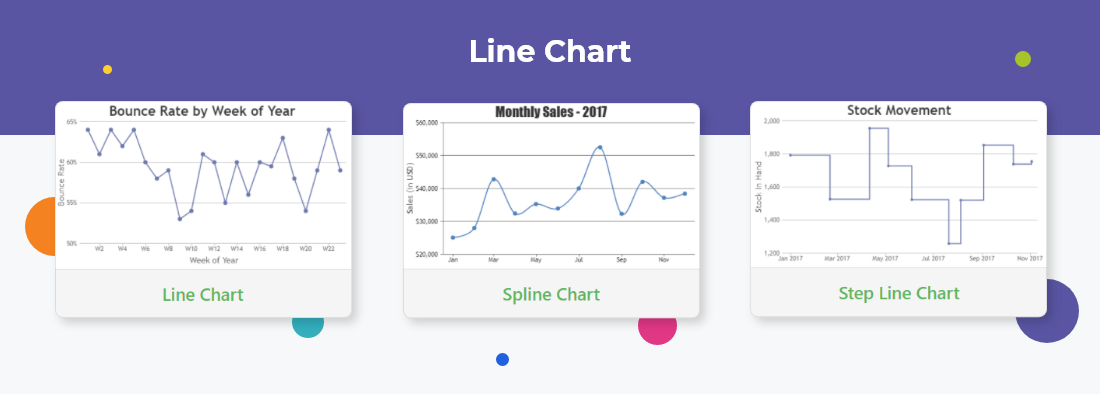
Line Chart
Depiction of data and analytics via a line, spline, or a step line chart.
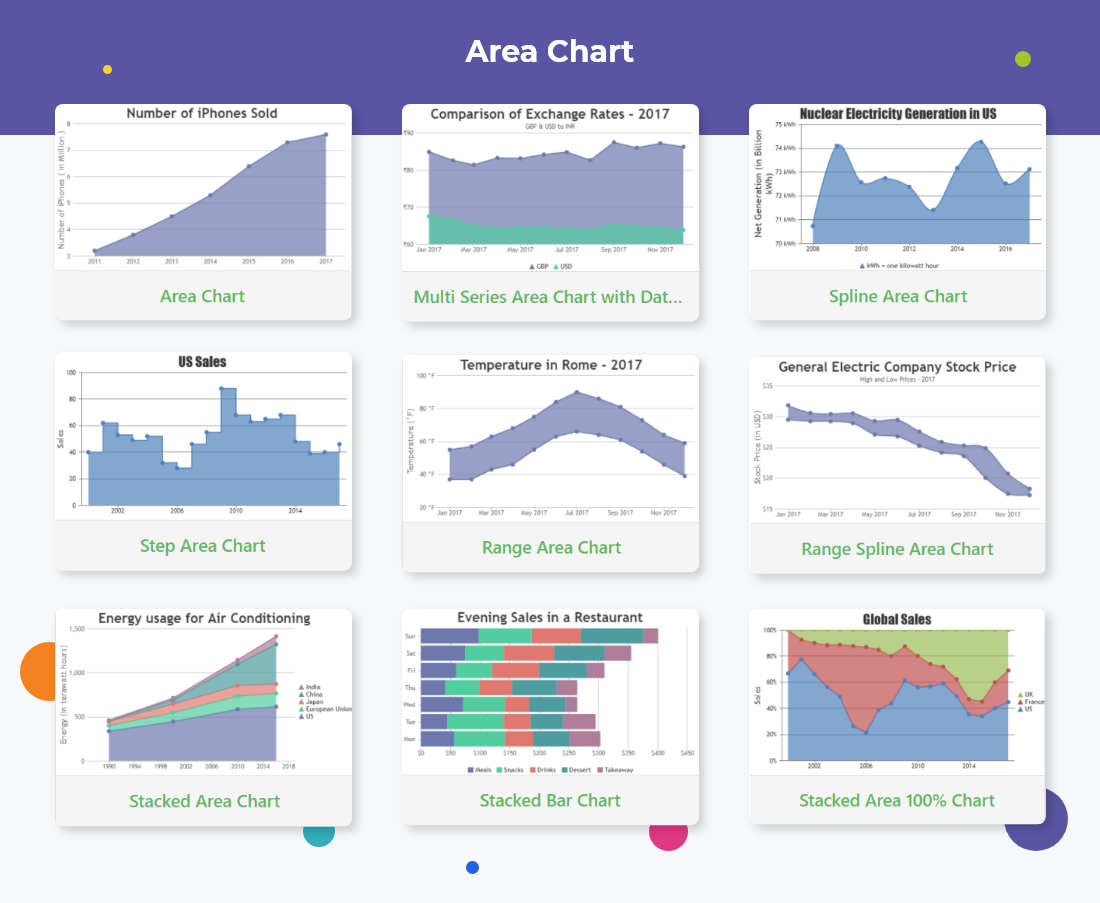
Area Chart
The graphical display of quantitative data with the emphasis on the line chart area coverings.
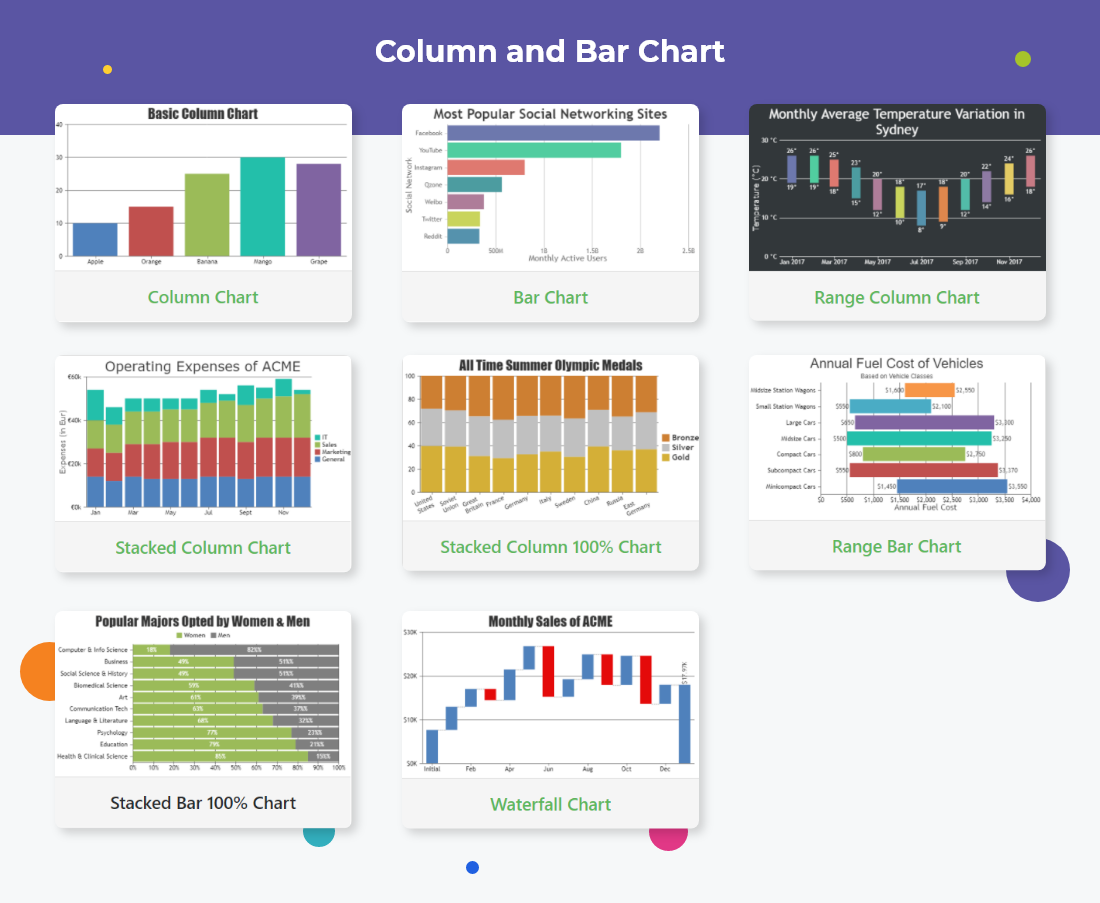
Column and Bar Chart
A representation of varied categories by depicting rectangular bars is a column chart.
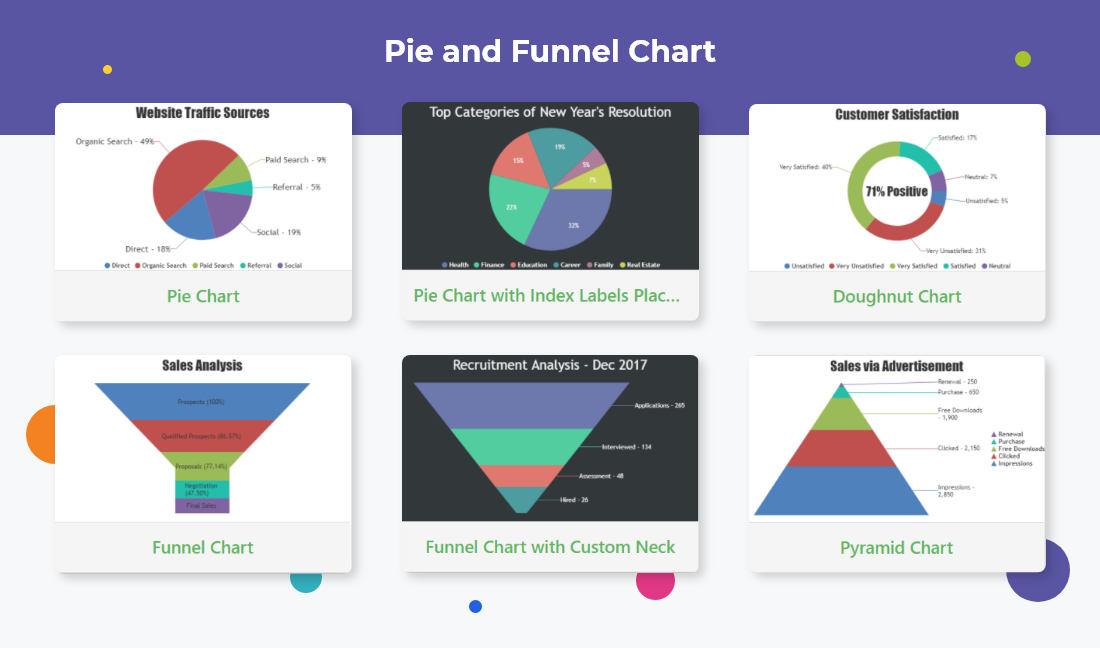
Pie and Funnel Chart
A circular graphical representation in the form of a pie, doughnut, slices, etc., to show the quantity in terms of the whole circle.
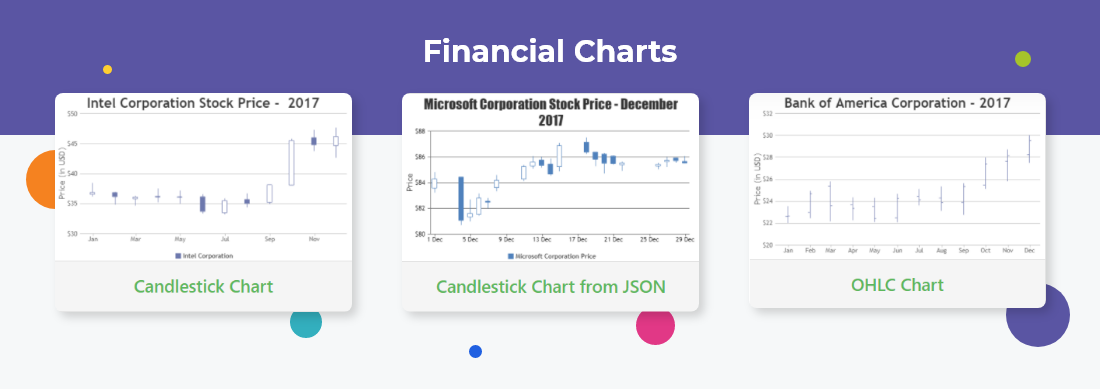
Financial Charts
An amazing depiction of financial metrics like liquidity, budgets, cash flow, expenses, etc., by candlesticks or OHLC charts.
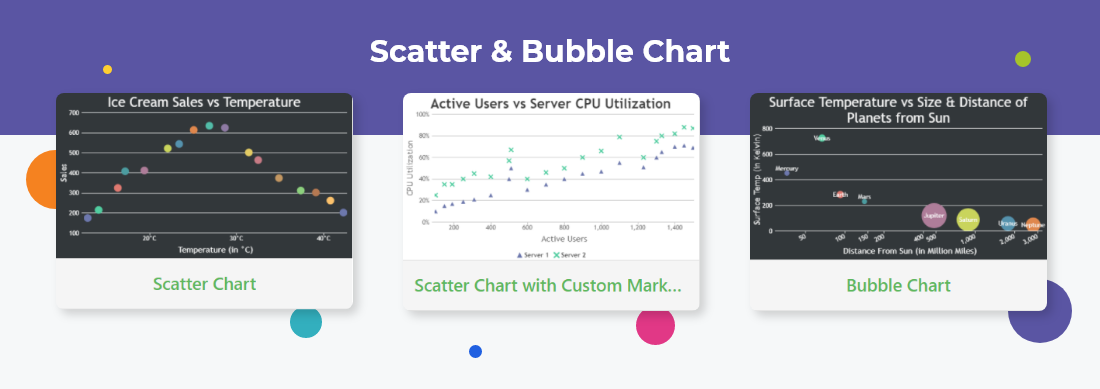
Scatter & Bubble Chart
Generally used to represent mathematical two-variable data sets or three-dimensional entities.
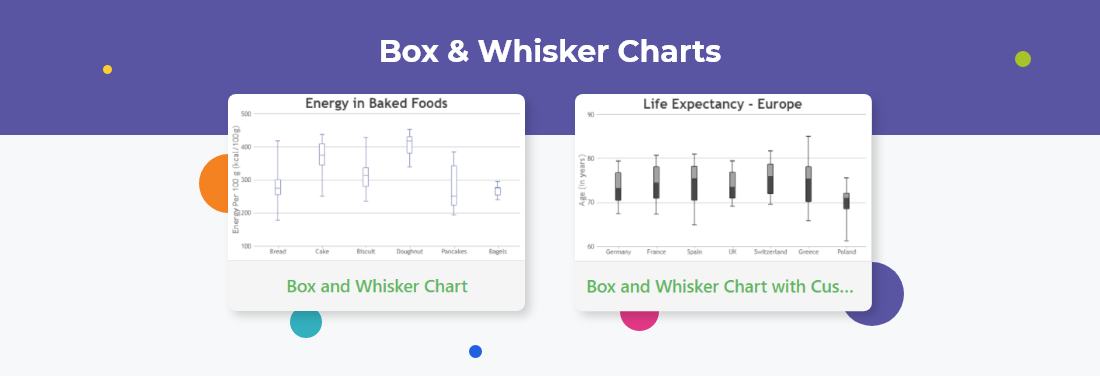
Box & Whisker Charts
Graphical representation of a set of numerical data via quartiles.
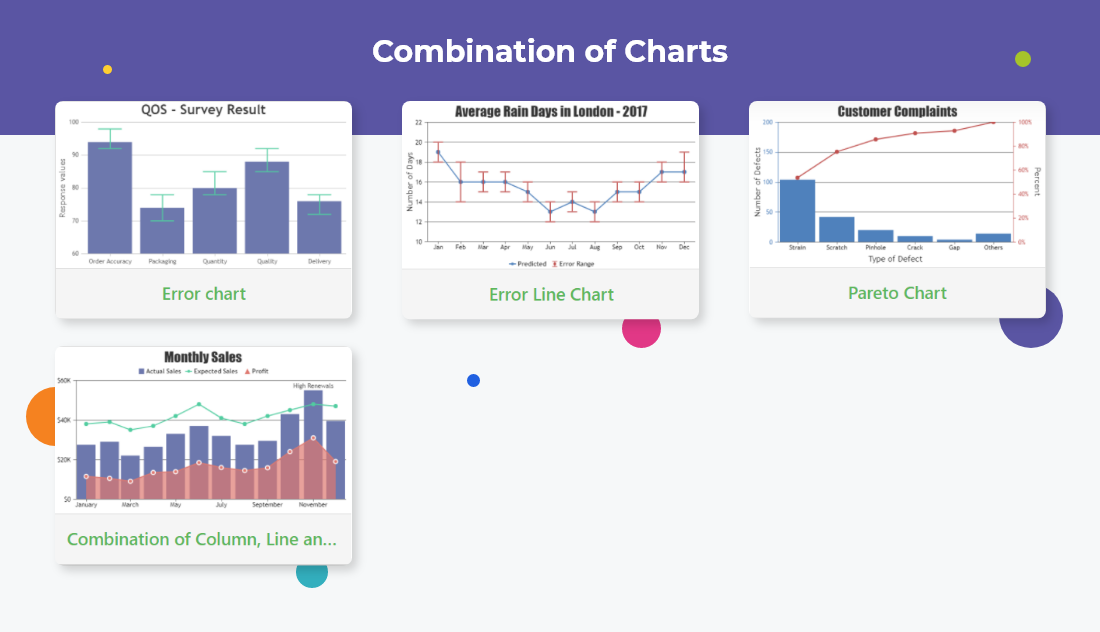
Combination Charts
As the name explains, combinations of line chart, bar chart, OHLC, area chart, etc.
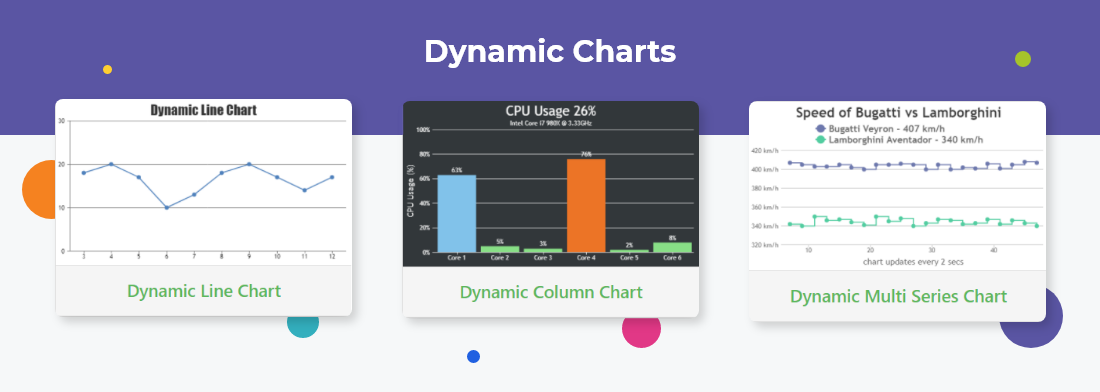
Dynamic Charts
The live updates are represented in real-time changing charts.
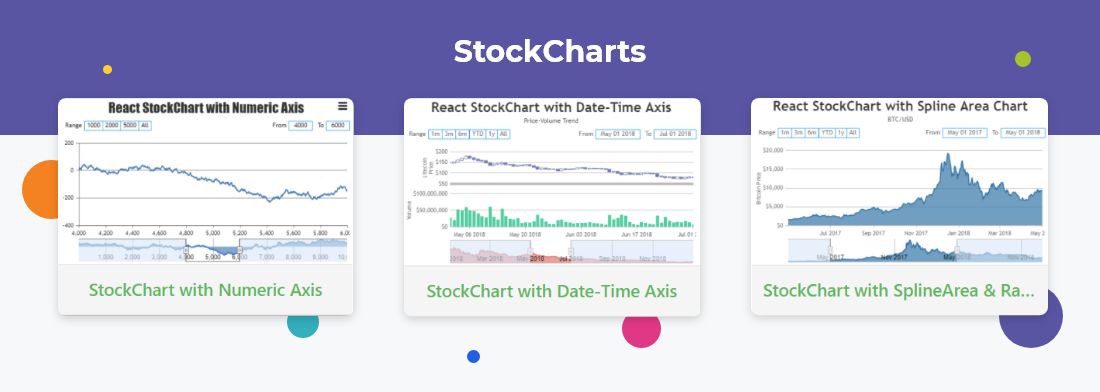
StockCharts
The representation of a price chart over a range of time-frame.
ReactJS for Dashboards and Data Visualization Examples
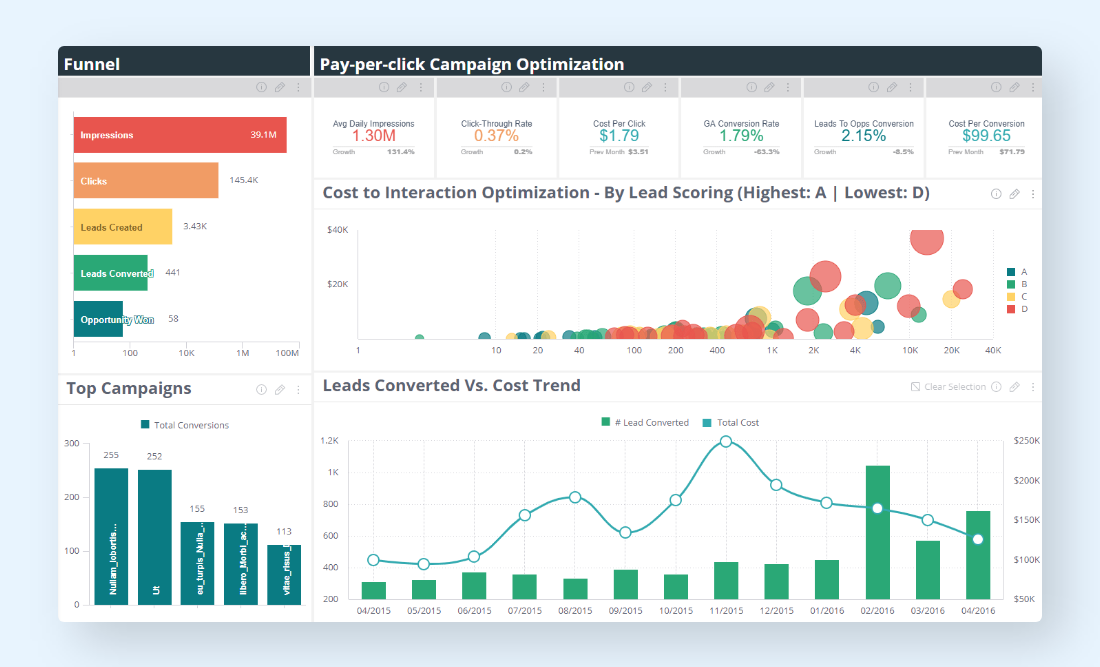
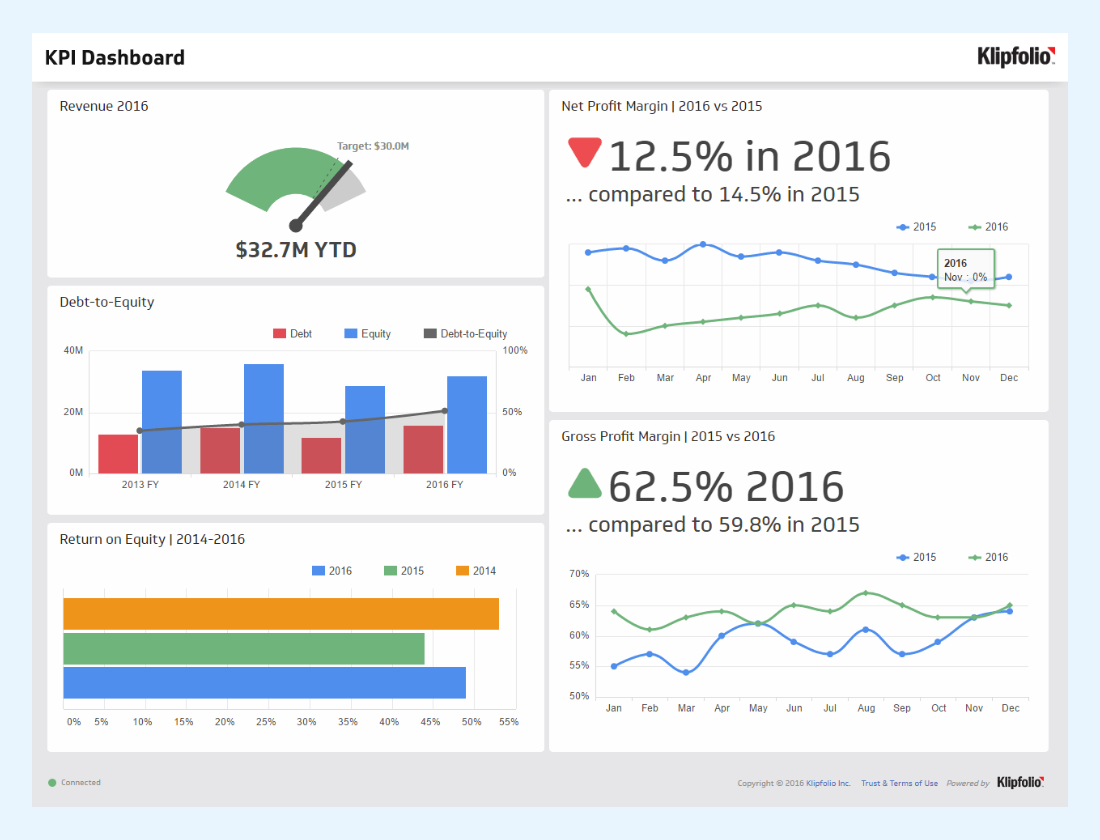
Marketing KPI Dashboard
Such dashboards depict critical business information quickly and interactively, helping the marketing guys make vital business decisions.
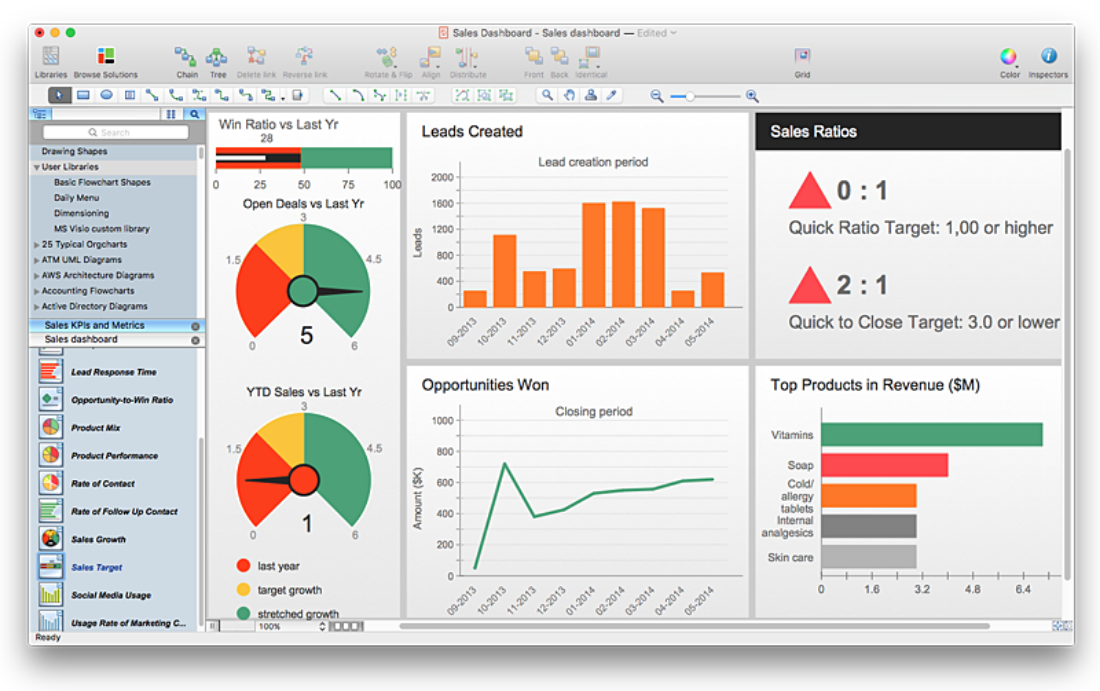
Sales Dashboard
To stay strong in the market, your business needs to cultivate a data-driven culture. The ReactJS sales dashboard guides your sales time with the right performance indicators and business metrics so that your business stays on the top charts.
Executive Dashboards
Business executives can monitor, track, and report using the digestible data from the dashboards and execute flawless business actions.
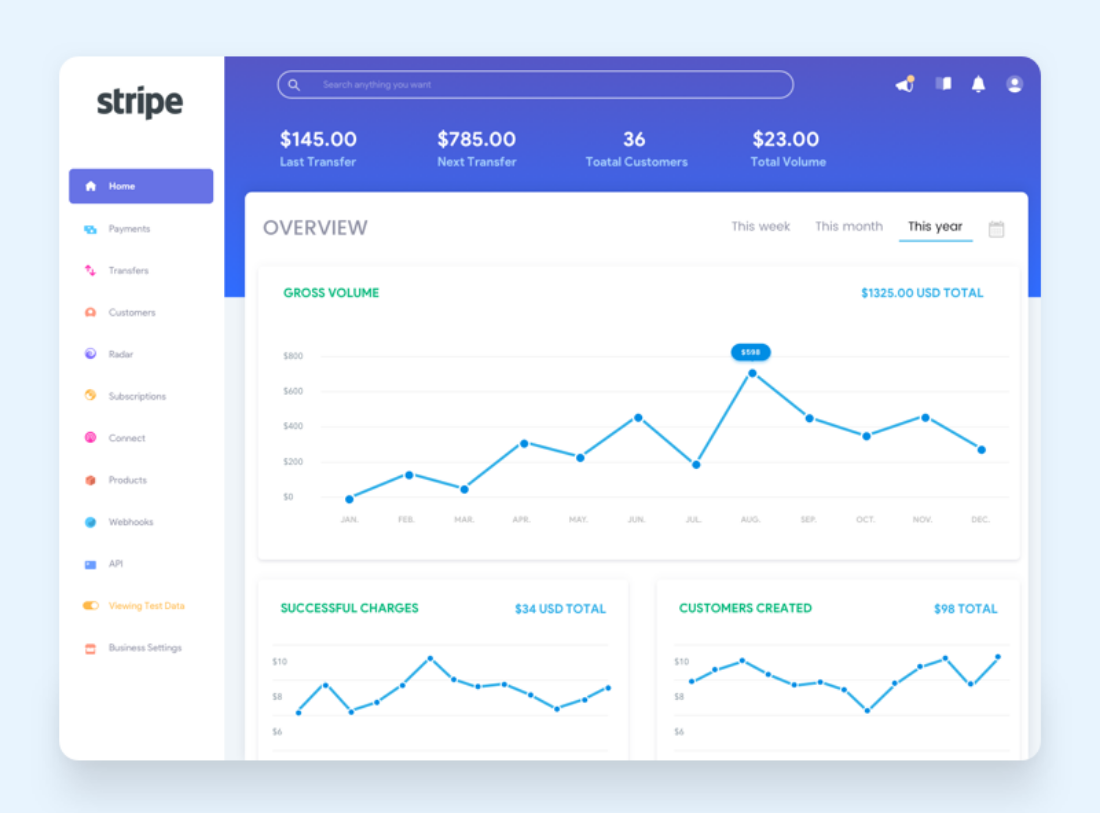
Stripe Dashboard
An amazing dashboard design that answers pertinent user queries and represents ideal fit margins for each card. Users can easily and quickly understand the graphical images.
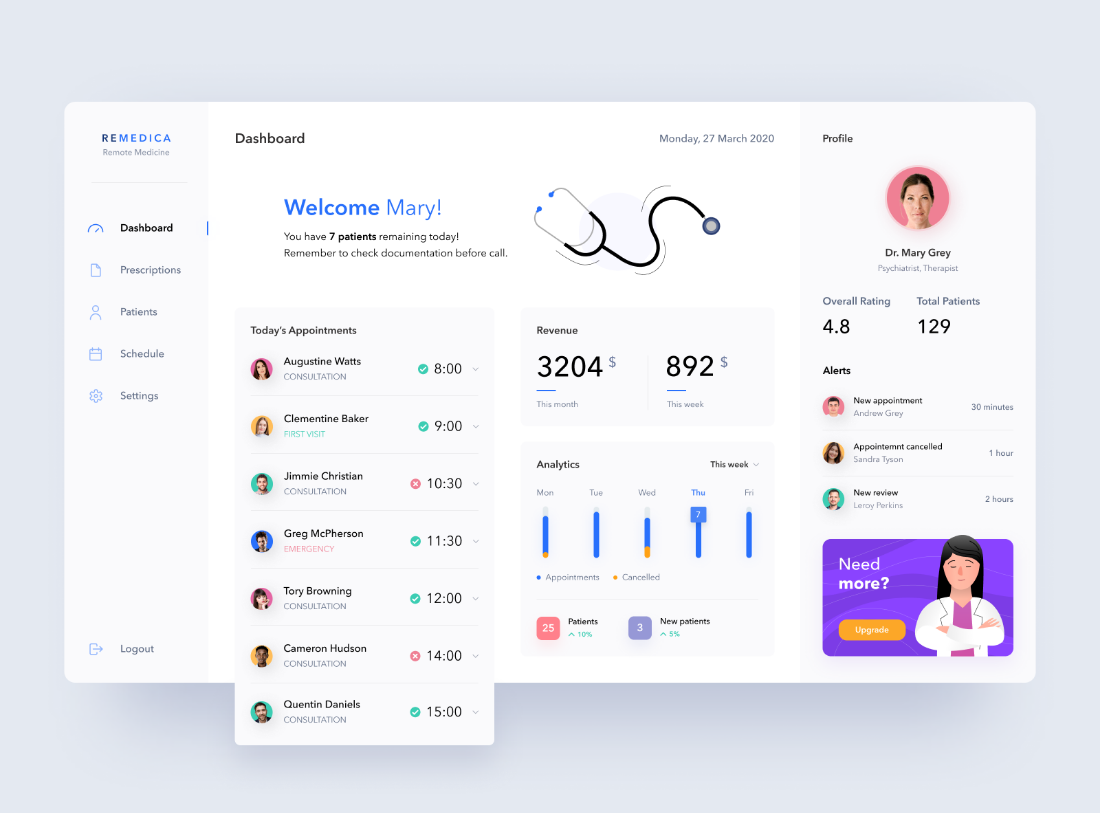
Telemedicine Dashboard
The crucial health data depicted in a raw format by implementing the UX best practices. The ReactJS telemedicine dashboard follows generous margins, color contrast, a balanced layout, and more to efficiently interpret data.
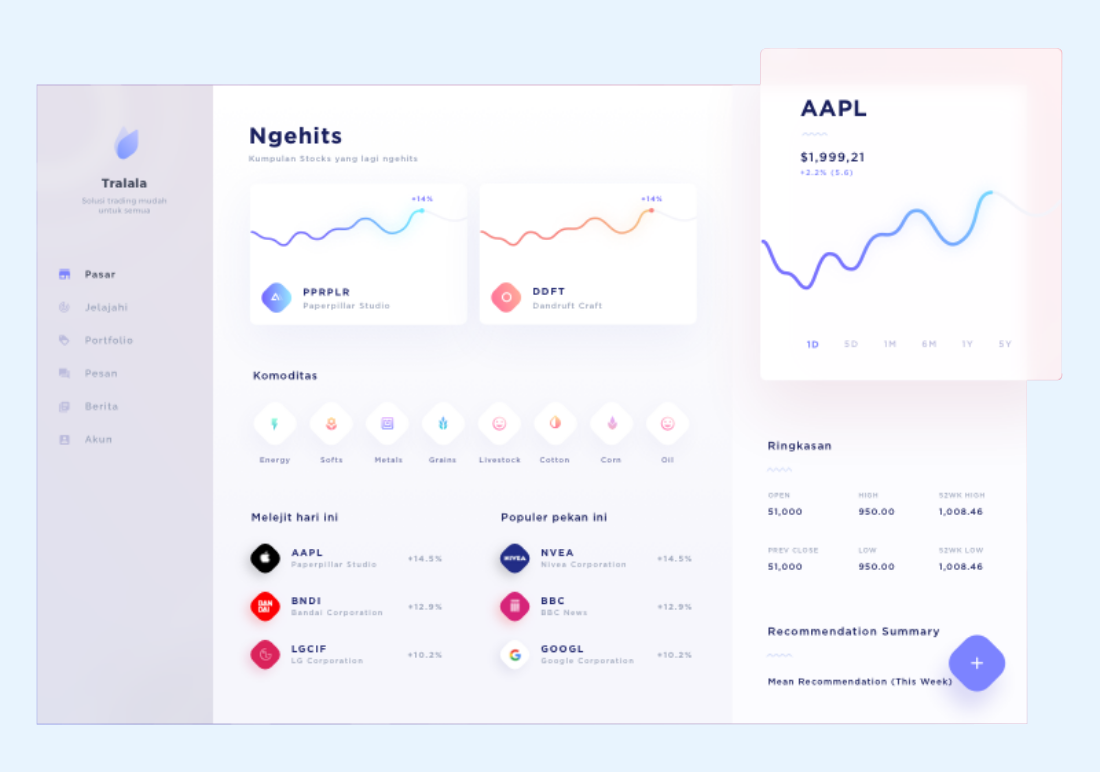
Stock Dashboard
The stock market is a huge load of information that is tricky to present on a single dashboard. However, the ReactJS stock dashboard attains the task of minimal look by depicting relevant information at the center and front.
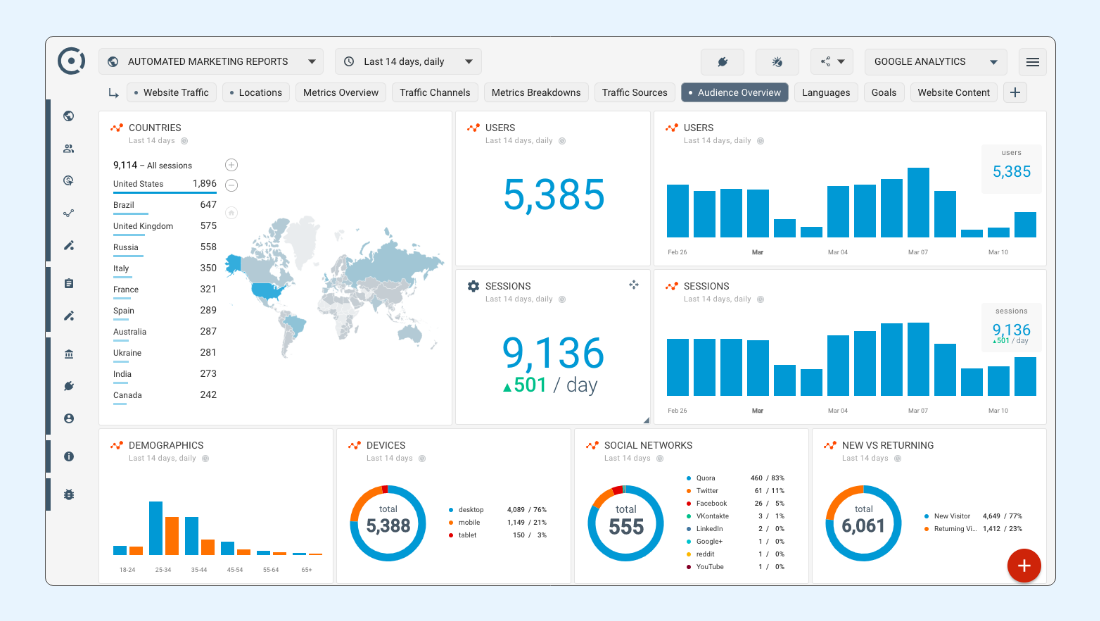
Web Audience Dashboard
Google analytics represent your viewer demographics in a lucid, helpful, and cognitive manner.
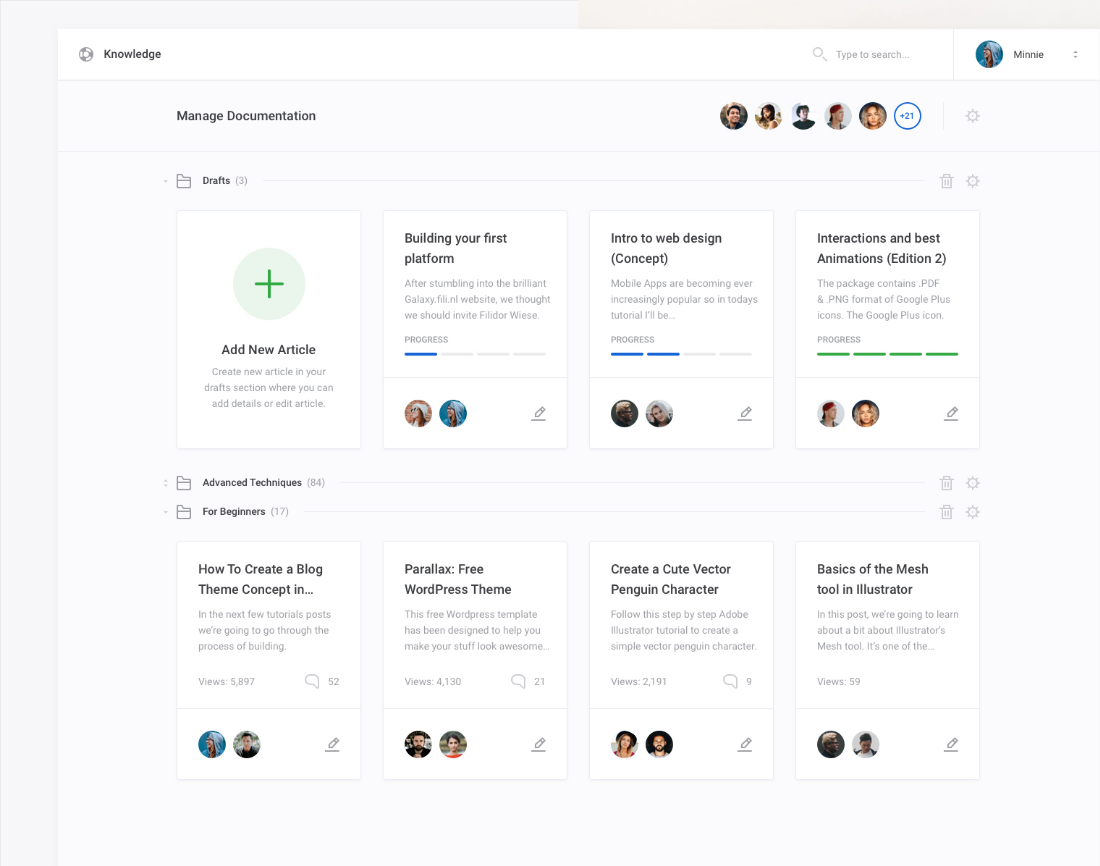
Documentation Management Dashboard
A minimalist approach and easy navigation to keep things sorted, managed, and sparse.
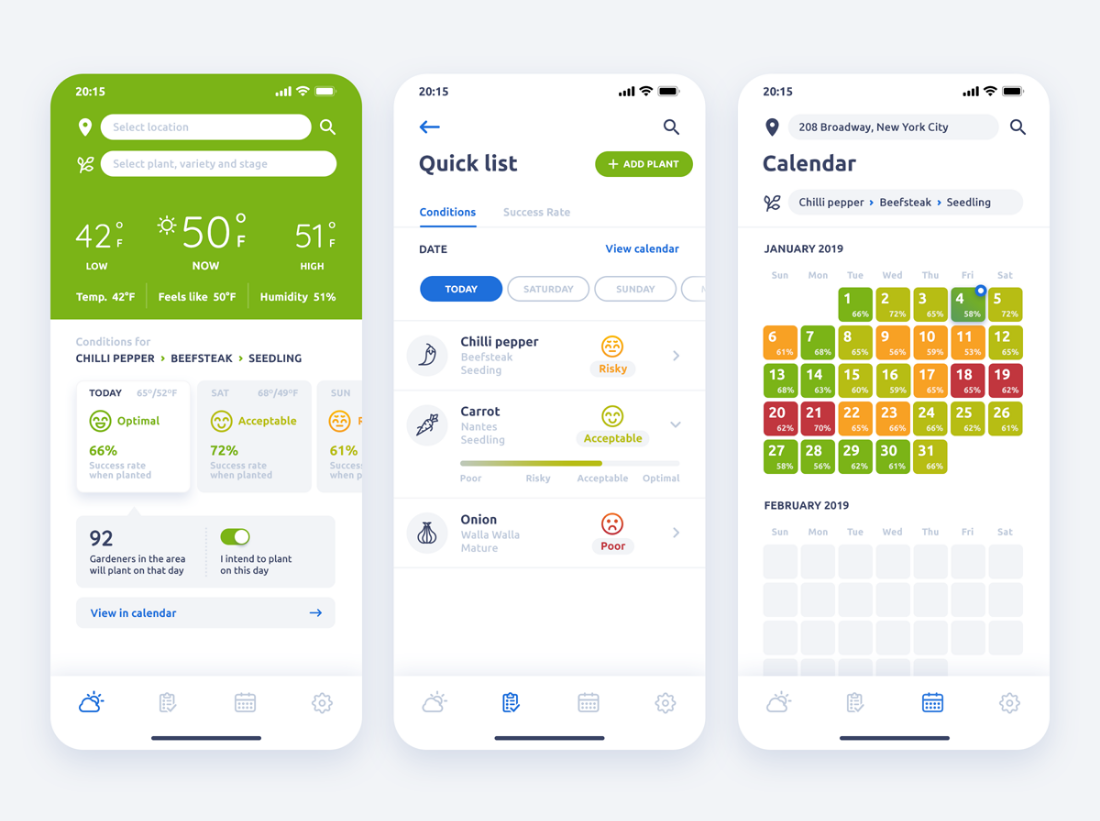
Weather App Mobile Dashboard
Easy-to-understand weather guiding React JS mobile app dashboard that connects the breadcrumbs with flawless navigation.
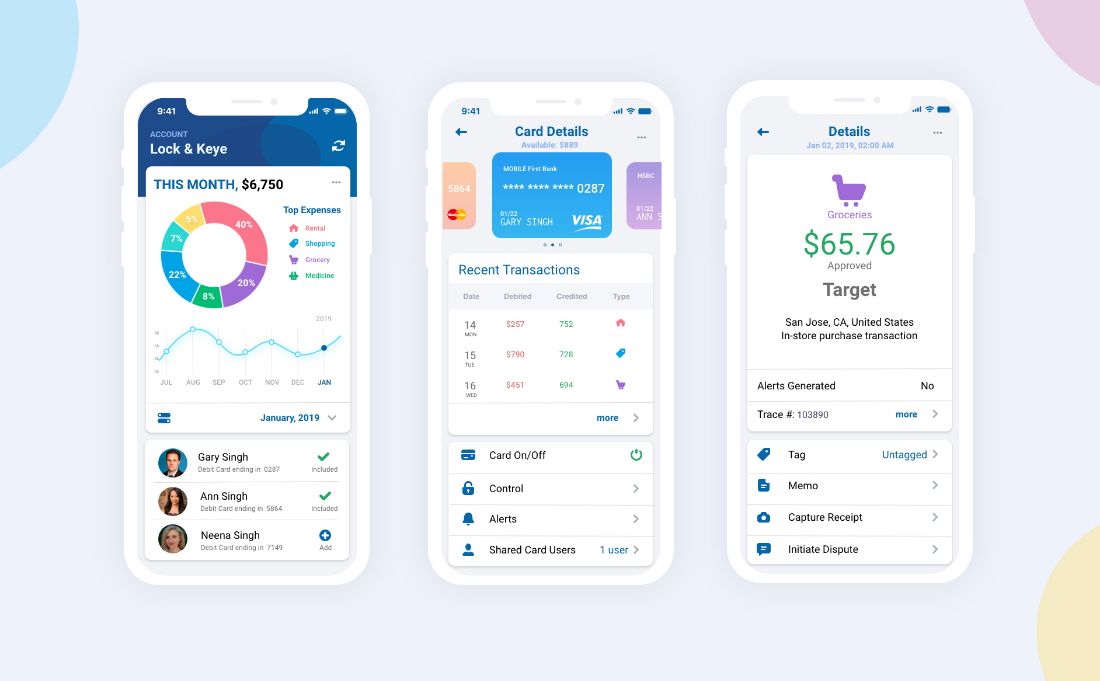
Credit Card Mobile Dashboard
The credit card dashboards are too comprehensive to be presented on a mobile dashboard, just like banking and finance. ReactJS library provides exclusive, useful, and overwhelming results.
Credit Card Mobile Dashboard
From all these above ReactJS dashboard examples, it is dominant that there is no better javascript library or framework that can help you develop fantastic dashboard applications for your business.
ReactJS Dashboard KPIs and Metrics
React JS Dashboards enable you to get a quick glimpse of your business performance through its metrics. You can mark your expected growth stories and aim for long-term goals.
A dashboard plays a vital role in making crucial decisions and denoting business needs. Dashboards are versatile- not just limited to specific industries or domains. Call-centers, healthcare, social media, SaaS, marketing, sales, etc. every sector leverages the perks of dashboards’ data.
Business KPIs- the data reduced by a dashboard that helps you determine growth, revenue, performance, and other such crucial factors of your business are the business key performance indicators. Your managers can take decisive steps backed up by these factors
High-level KPIs- they determine the major evaluatory factors of your overall business performance.
Low-level KPIs- they are narrowed to intricate team-wise goals, department-performance.
Here are frequently monitored KPIs that entrepreneurs deduce from ReactJS dashboards:
- Growth Rate
- Revenue
- Net profit
- Customer lifetime value
- Projects completed in time or Project schedule variance
- Churn rate
- Each customer’s average revenue
Conclusion
Your business success is directly proportional to your decision making speed. To quickly, intricately, and comprehensively analyze your business performance, React dashboards keep you ahead of your competitors by portraying crucial information in a useful and graphical representation. Hire ReactJS developers from us and evolve your business indices from the fruitful React Dashboard development.
Frequently Asked Questions (FAQs)
Yes, you should immediately hire full-stack React JS developers from us and get your business KPIs by getting your dashboard migrated to a high-performant React dashboard.
Sure, we do. As you hire our skilled React native developers who are experienced in building mobile-friendly and responsive apps, you can leverage the advantage of React JS dashboard development for both web and mobile users.
Indeed, yes, you will 100% save time and money by hiring react js developers from our company.
Your Success Is Guaranteed !
We accelerate the release of digital product and guaranteed their success
We Use Slack, Jira & GitHub for Accurate Deployment and Effective Communication.


