Nowadays, when Artificial Intelligence comes into the picture, everyone wants to know more and more about it. With the help of data analytics, people want to create amazing experiences, and obviously, it is possible with a significant amount of data. With aligned data, we can give data analytics training to our model to perform exciting tasks.
But the question is, will every dataset be ready to use just like the Kaggle datasets?
Well, I am not sure I have doubts about that!
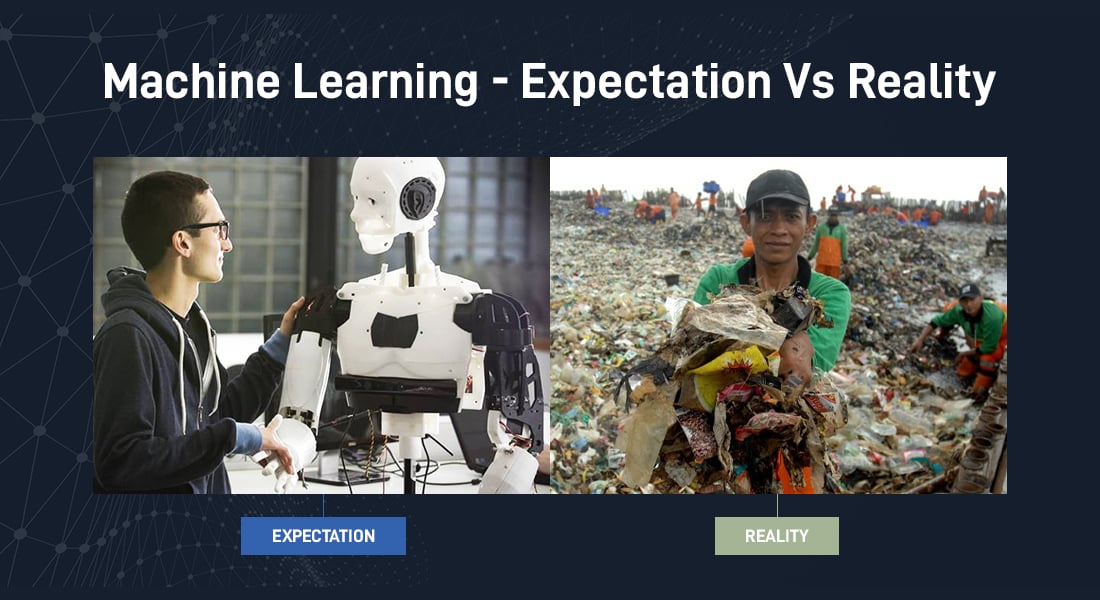
In the real-world, data is super messy. And to deal with this data and to make use of it in the real-world models, Data Analytics plays a significant role. So, first, let me get you through a general introduction to data analytics.

What Do You Mean by Data Analytics:
As the name suggests, data analytics is to analyze the data, which can be very useful for Business Intelligence to make very accurate decisions or for AI Developers to train the models. Nowadays, data is not only limited to text data. There are various types of data that we are using, which include images, videos, or even live streaming, where we are generating tons of data. Data Analytics provides cleaning, categorizing, identifying the patterns of the data, filling the missing value of the data, and many more according to datasets.
Why We Need Data Analytics:
Data analytics is a tool that helps to identify hidden trends and seasonality and can also be used to generate more revenues or improve the efficiency of marketing. In this competitive world, data analytics gives information that makes a business stay ahead. In summary, data also has a pattern. If we are able to find the pattern, we can solve more business issues, e.g., we can find out how many customers of ISP companies will move to other service providers based on data usages.
We can create the model from time-series data (If data contains the timestamp, it is known as time-series type data). There are many different use cases of that, i.e., one can do weather forecasts or predicting how many products are going to be sold in a specific period or even stock forecasting can you believe it!
Method for conducting data analysis:
There are mainly two methods to perform data analysis
- Qualitative analysis
- Quantitative analysis
The qualitative analysis focuses on the quality or features of the data. These data include information taken from customer critiques, interviews with employees, and generally refer to conditions over quantities.
On the other hand, the quantitative analysis focuses on the numbers; it all about the amount of the data. These data include sales numbers, marketing data such as click-through rates, payroll data, revenues, and other data that can be counted and measured objectively.
Feature Data:
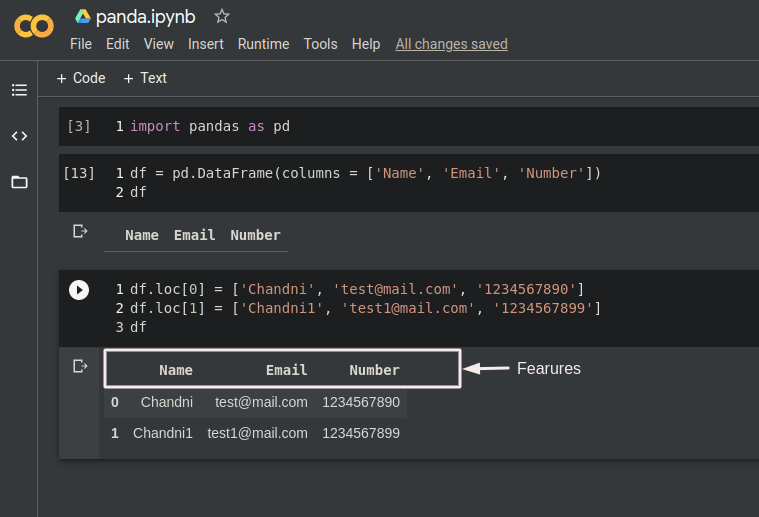
A feature is a parameter or a property of the object. Generally, in a dataset, it appears as a column.

The above example of the pandas shows the creation of data frames. You can identify that there are three features in this data: Name, Email, and Number.
Relation Between Features:
With different algorithms of data analysis and using some of the many available data analytics tools in the market, it is very easy to find out connections between the features. One way to find out the relation between the features is data correlation. Data correlation is a way to understand the relationship between multiple functions in our dataset. If we can find out the relationship between features, then we can use it to increase our productivity or our selling.
Let’s consider the example of “selling of milk” and “selling of bread”. So if we will perform a positive correlation, then we will find out that if the feature “selling of milk” increases, then the feature “selling of bread” also increases or if the feature “selling of milk” decreases then the feature “selling of milk” also decreases. Both features will move in the same direction as they have a linear relationship. This way, we can predict the selling amount of the product and manage the stock accordingly.
What is Feature Engineering and Why Is it Essential?
Feature engineering is the process of transforming row or unclassified data into feature data or even creating new features to understand and make a more desirable representation of data.

Data scientists spend 80% of their time on data preparation and the remaining 20% on creating or evaluating the AI models, thus organizations prefer to hire data scientist who can dominate the data and extract the meaning out of it to assist the team in taking key decisions. If you analyze the above chart, you will understand that the majority of the time a data scientist spends is for cleaning and organizing the data, which is known as feature engineering.
Conclusion:
The applications of data analytics are comparatively large. Scrutinizing big data can optimize competence in various industries. In the future, data analytics will be a significant part of the financial and banking sectors as nowadays, frauds are increasing, and we have so much data so that we can generate very efficient models. With the help of data analytics, if you want to create AI-based innovative solutions, then hire artificial intelligent consultant now to automate your business and optimize the processes. We have top-of-the-line expertise in offering Artificial intelligence and machine learning development services.

